Welcome back to the Unicorn Club, 10 years later
Aileen Lee is the founder of Cowboy Ventures. She partners at the earliest stages with enterprise and consumer-oriented startup teams to build products customers love, and to help teams build aspirational companies. She has over two decades of experience starting at seed stage and staying involved for many years beyond.
Allegra Simon loves working closely with incredible early-stage founders, cultivating the Cowboy community, and wearing many different hats as Chief of Staff to keep the Cowboy ranch thriving. She works closely with Aileen on new venture diligence, portfolio support, and everything else.
It’s been a decade since publishing “Welcome to the Unicorn Club,” so it’s a good time to reflect on what’s happened since.
In 2013, Cowboy Ventures had just gotten started. To inform our investment strategy, we assembled and studied a dataset of U.S.-based, VC-backed startups that had grown to be worth more than $1 billion within 10 years, using the term “unicorn” as a shorthand to capture how magical these companies seemed.
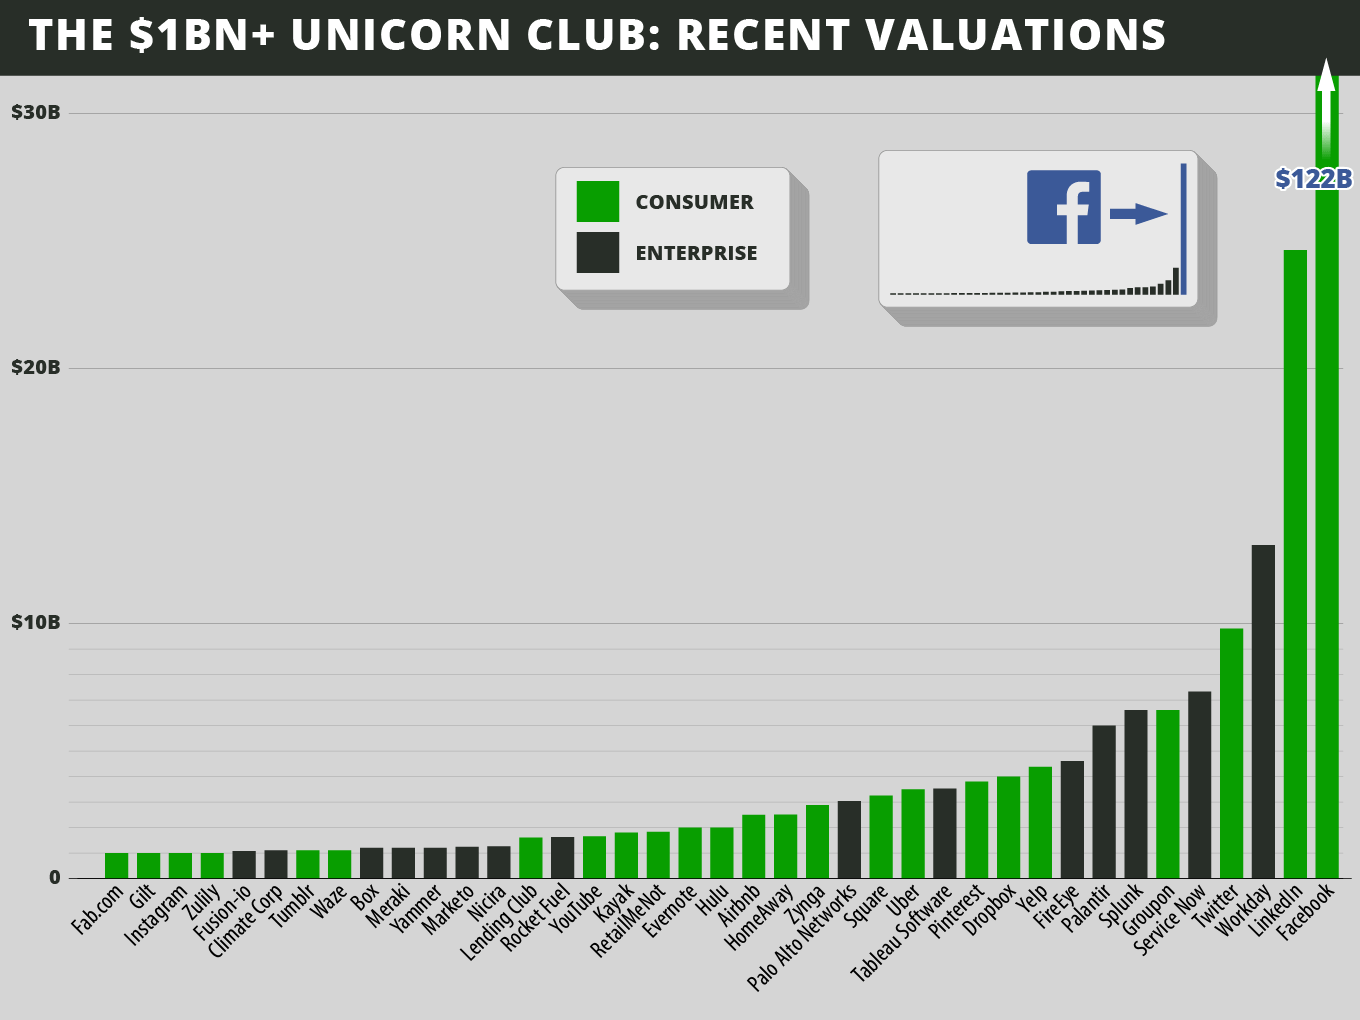
The most successful VC-backed U.S. tech companies less than 10 years old in 2013. Image Credits: Cowboy Ventures
Our original analysis found only 39 unicorns out of the thousands of startups that had been founded by then. Some highlights:
- The majority (62%) had gone public or been acquired.
- The majority were consumer-oriented: around 60% of companies, making up 80% of the value.
- Enterprise-oriented companies had 26x capital efficiency (current valuation divided by private capital raised), which was 2.4x better than consumer companies.
- One company became a “superunicorn” (worth more than $100 billion) in that decade: Facebook.
- Contrary to the prevailing stereotype, the average age of a unicorn’s founder was 34; it was 38 for enterprise software companies.
- The vast majority of companies had three co-founders and common work, school and tech experience.
- The Bay Area was HQ to 70% of unicorns. New York, home to three, was the second-largest hub.
- There was very little diversity: no female CEOs, and just 5% of unicorns had a female co-founder.
2013 to 2021: A rising tide for VC funds, startups and valuations

Capital in the VC ecosystem tripled in a decade. Source: NVCA Q3 2023 VC Monitor, NVCA 2022 Yearbook, Federal Reserve Economic Data. Image Credits: Cowboy Ventures
Historical returns, growing markets (including social, mobile, cloud, commerce security, crypto and AI), COVID-era effects and low interest rates drove 3x more capital ($580 billion more!) into VC funds between 2013 and 2021 (and increased VC fee income by more than $11 billion).
This enabled established VC firms to raise record-breaking funds; public “crossover” funds joined the party; and over a thousand newer firms also raised funds. The industry gained thousands of new investors with fresh checkbooks and limited mentorship or oversight, given the pace.
In 2021, it was a perfect storm of near-zero interest rates and much of the world spending their days behind screens, increasingly reliant on technology for work and life. Due-diligence processes were rushed, round sizes and valuations broke records, and a huge herd of unicorns was crowned.
The tide turns

Investment in private companies mirrored the Nasdaq climb. Source: PitchBook-NVCA Venture Monitor, NVCA 2022 Yearbook, Federal Reserve Economic Data. Image Credits: Cowboy Ventures
In March 2022, the Fed raised rates, triggering a multiyear downward effect on public companies’ revenue multiples and enterprise software firms’ budgets. Although big VC firms continued to raise big money (64% of venture capital raised in 2022 went to funds bigger than $1 billion), investors mostly froze their investments (around 40% of VCs stopped dealmaking in 2023). Companies refocused on margins and profitability, cutting costs in several waves. Unicorns started to fall via down rounds, public delistings and shutdowns.
But since 2013, there were 532 companies that joined the Unicorn Club. Similar to our original analysis, our 2023 dataset covers U.S.-based, VC-backed tech companies most recently valued at more than $1 billion in public or private markets and founded in 2013 or later.
We use PitchBook, Crunchbase, People Data Labs, and news articles as sources but private market data is challenging. If you spot something inaccurate or we missed, please let us know at Cowboy Ventures.
To note: Last-round valuations are an imperfect gauge, and they likely inflate the current herd size and value; Cerebral, Clubhouse and OpenSea may be good examples. Using the point-in-time methodology also leaves some companies out. For example, Stripe was founded in 2010, Zoom in 2011, and Snowflake and Coinbase in 2012. None of these was a unicorn in 2013 when we did the original analysis, and now they are more than 10 years old, so they’ve been excluded from this dataset.
Here’s a brief look at our takeaways about the 532 companies in the 2023 Unicorn Club. Read on for a deeper dive into how things have changed over the last 10 years:
- The number of unicorns ballooned 14x in the past decade, from 39 to 532! They now serve a wider array of sectors (we’re tracking 19), from climate and crypto to vertical SaaS.
- The pendulum swung hard to enterprise, with 78% of unicorns today focused on B2B, the inverse of 2013.
- Still, it’s a wobbly, bloated herd that will thin in the coming years (likely to about 350) because . . .
- A whopping 93% are “papercorns”: privately valued companies.
- 60% are “ZIRPicorns”: Their last valuations were from 2020–2022, when interest rates were near zero, and many of these are running out of runway.
- Around 201% of unicorns are on the cusp, valued at just about $1 billion.
- Around 40% are trading at less than $1 billion in the secondary markets.
- BUT, there is lots of substance in this herd. And we see evidence of a Software Unicorn Power Law: The U.S. will be home to more than 1,000 unicorns by 2033.
- There have been very few exits. Only 7% (35 companies) versus 66% a decade ago.
- Capital efficiency declined significantly. This will be bad for exits, venture returns, founders and employees.
- OpenAI will likely be the first superunicorn of the decade, and AI likely the mega-trend.
- The Bay Area was home to more unicorns this time around but lost share as other hubs grew.
- More unicorns means more founders, but some things didn’t change at all.
- Diversity is still wanted, and there’s a lot of opportunity to improve the composition of founding teams.
- If the past is a prologue, expect a mixed outlook for the current herd and many more unicorns in the future.
A deeper dive on where we are today
Unicorns ballooned 14x in the past decade
This herd is worth a staggering $1.5 trillion in aggregate value (versus $260 billion in 2013). But becoming a unicorn is still not easily done: Less than 1% of VC-backed startups go on to become worth more than $1 billion. An ideal candidate is five times more likely to get into Stanford, Harvard or MIT than to found a unicorn.
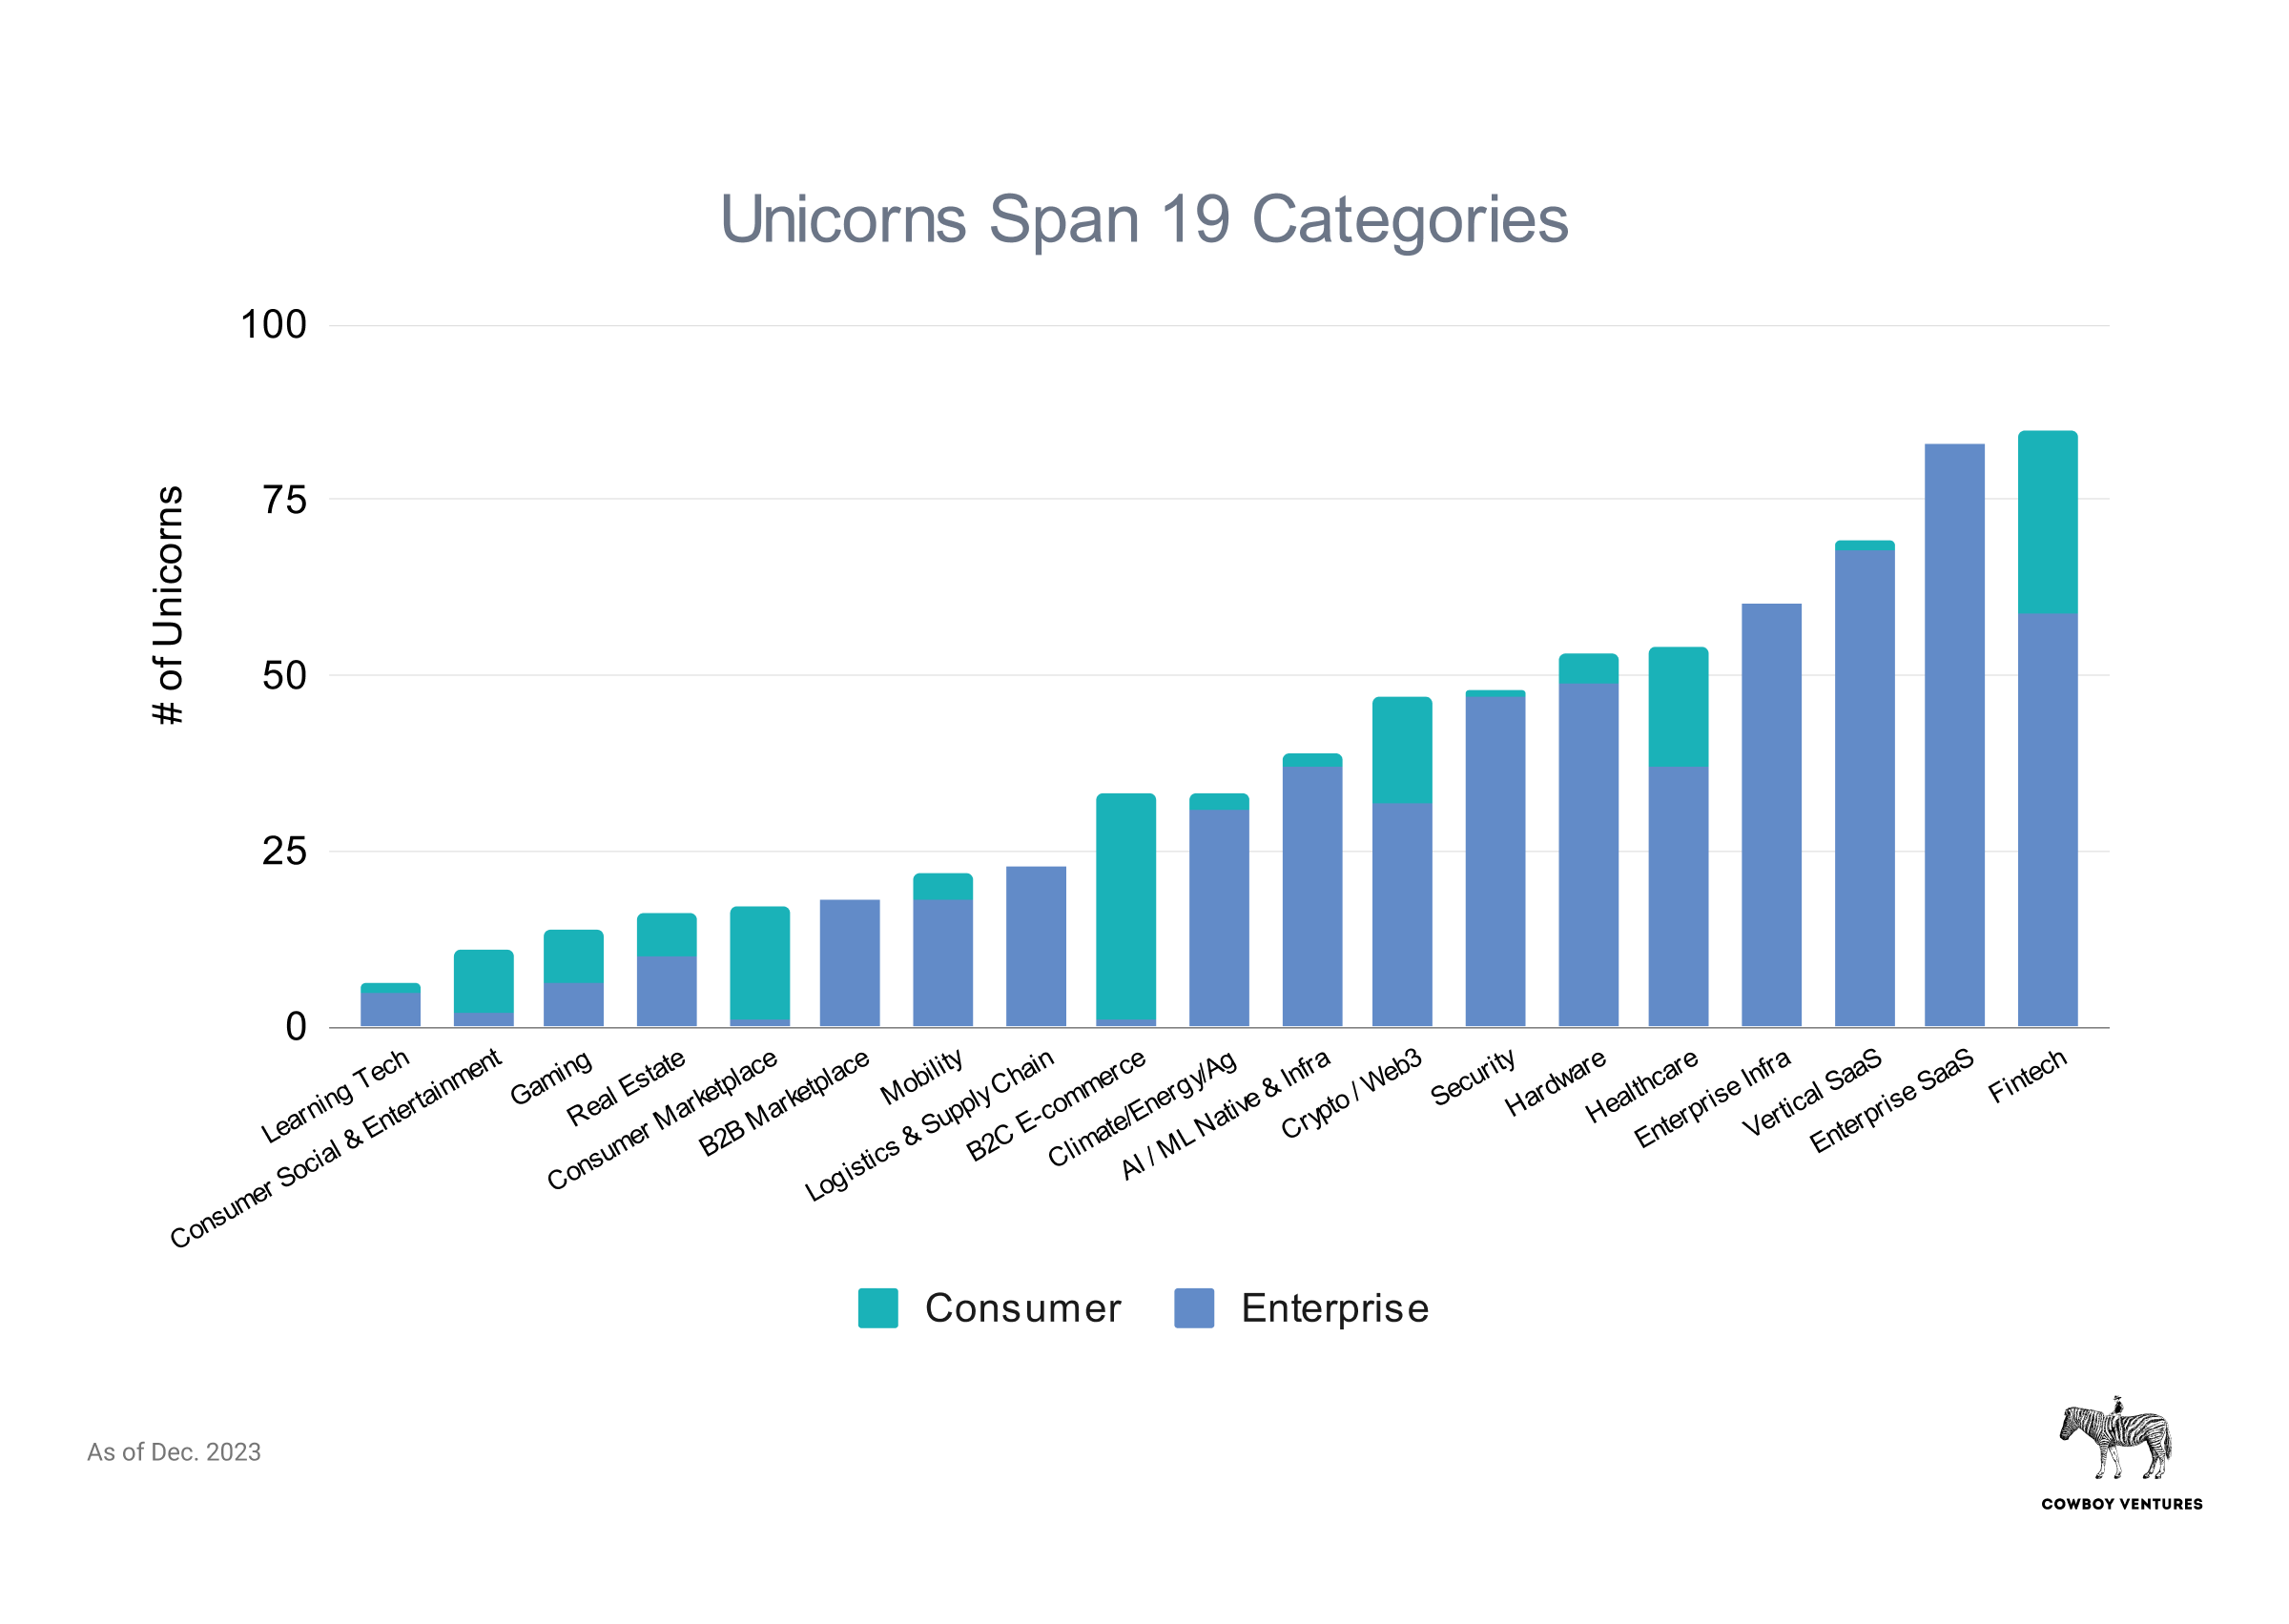
Unicorns in 2023 innovate across an array of sectors. Image Credits: Cowboy Ventures
Unicorns now also span a wider array of sectors (we’re tracking 19!). Most of these sectors weren’t on our 2013 list (social, commerce and general enterprise dominated back then). Click the gallery below to learn more about the most valuable companies in each sector.
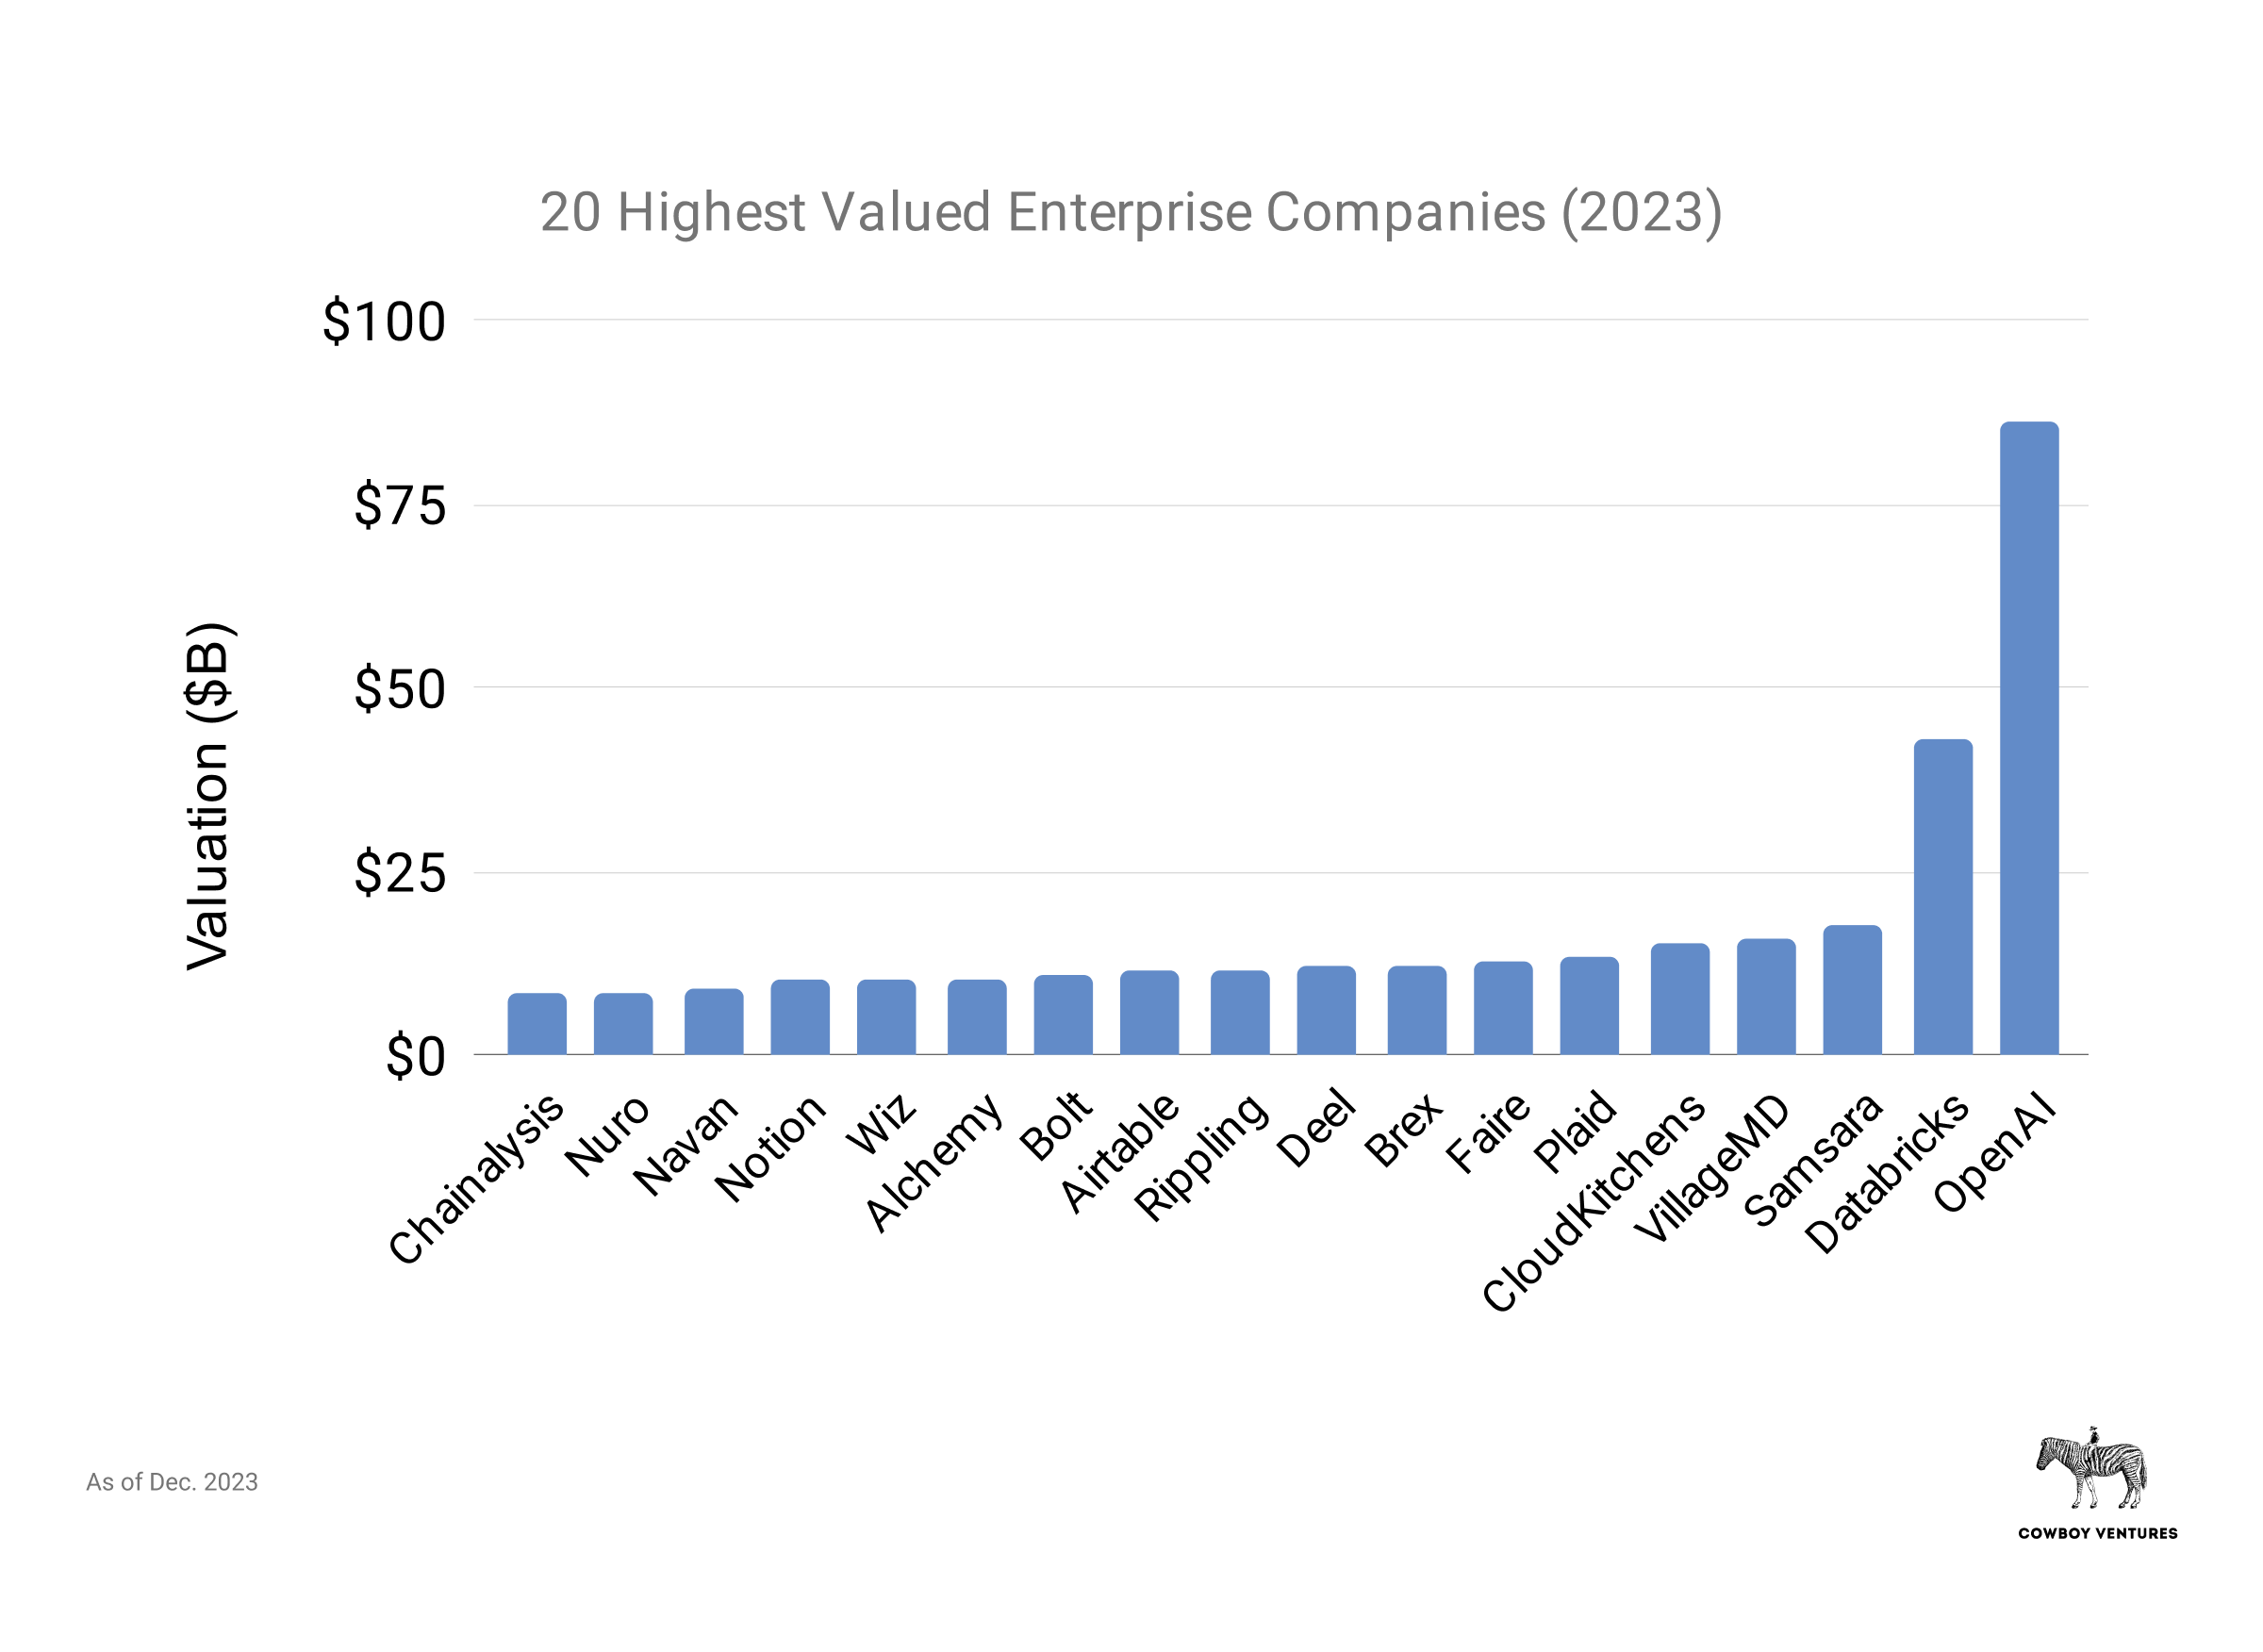
The most valuable companies are in very different sectors compared to 2013.
The most valuable unicorns in 2023 have innovated across a wide spectrum that stretches from general AI and healthcare to food delivery, HR software and stock trading. That marks a big departure from the sectors on the 2013 list. As previously noted, last-round valuation is an imperfect gauge: 75% of the “unexited” companies in this top 20 list were last valued in 2022 or earlier.
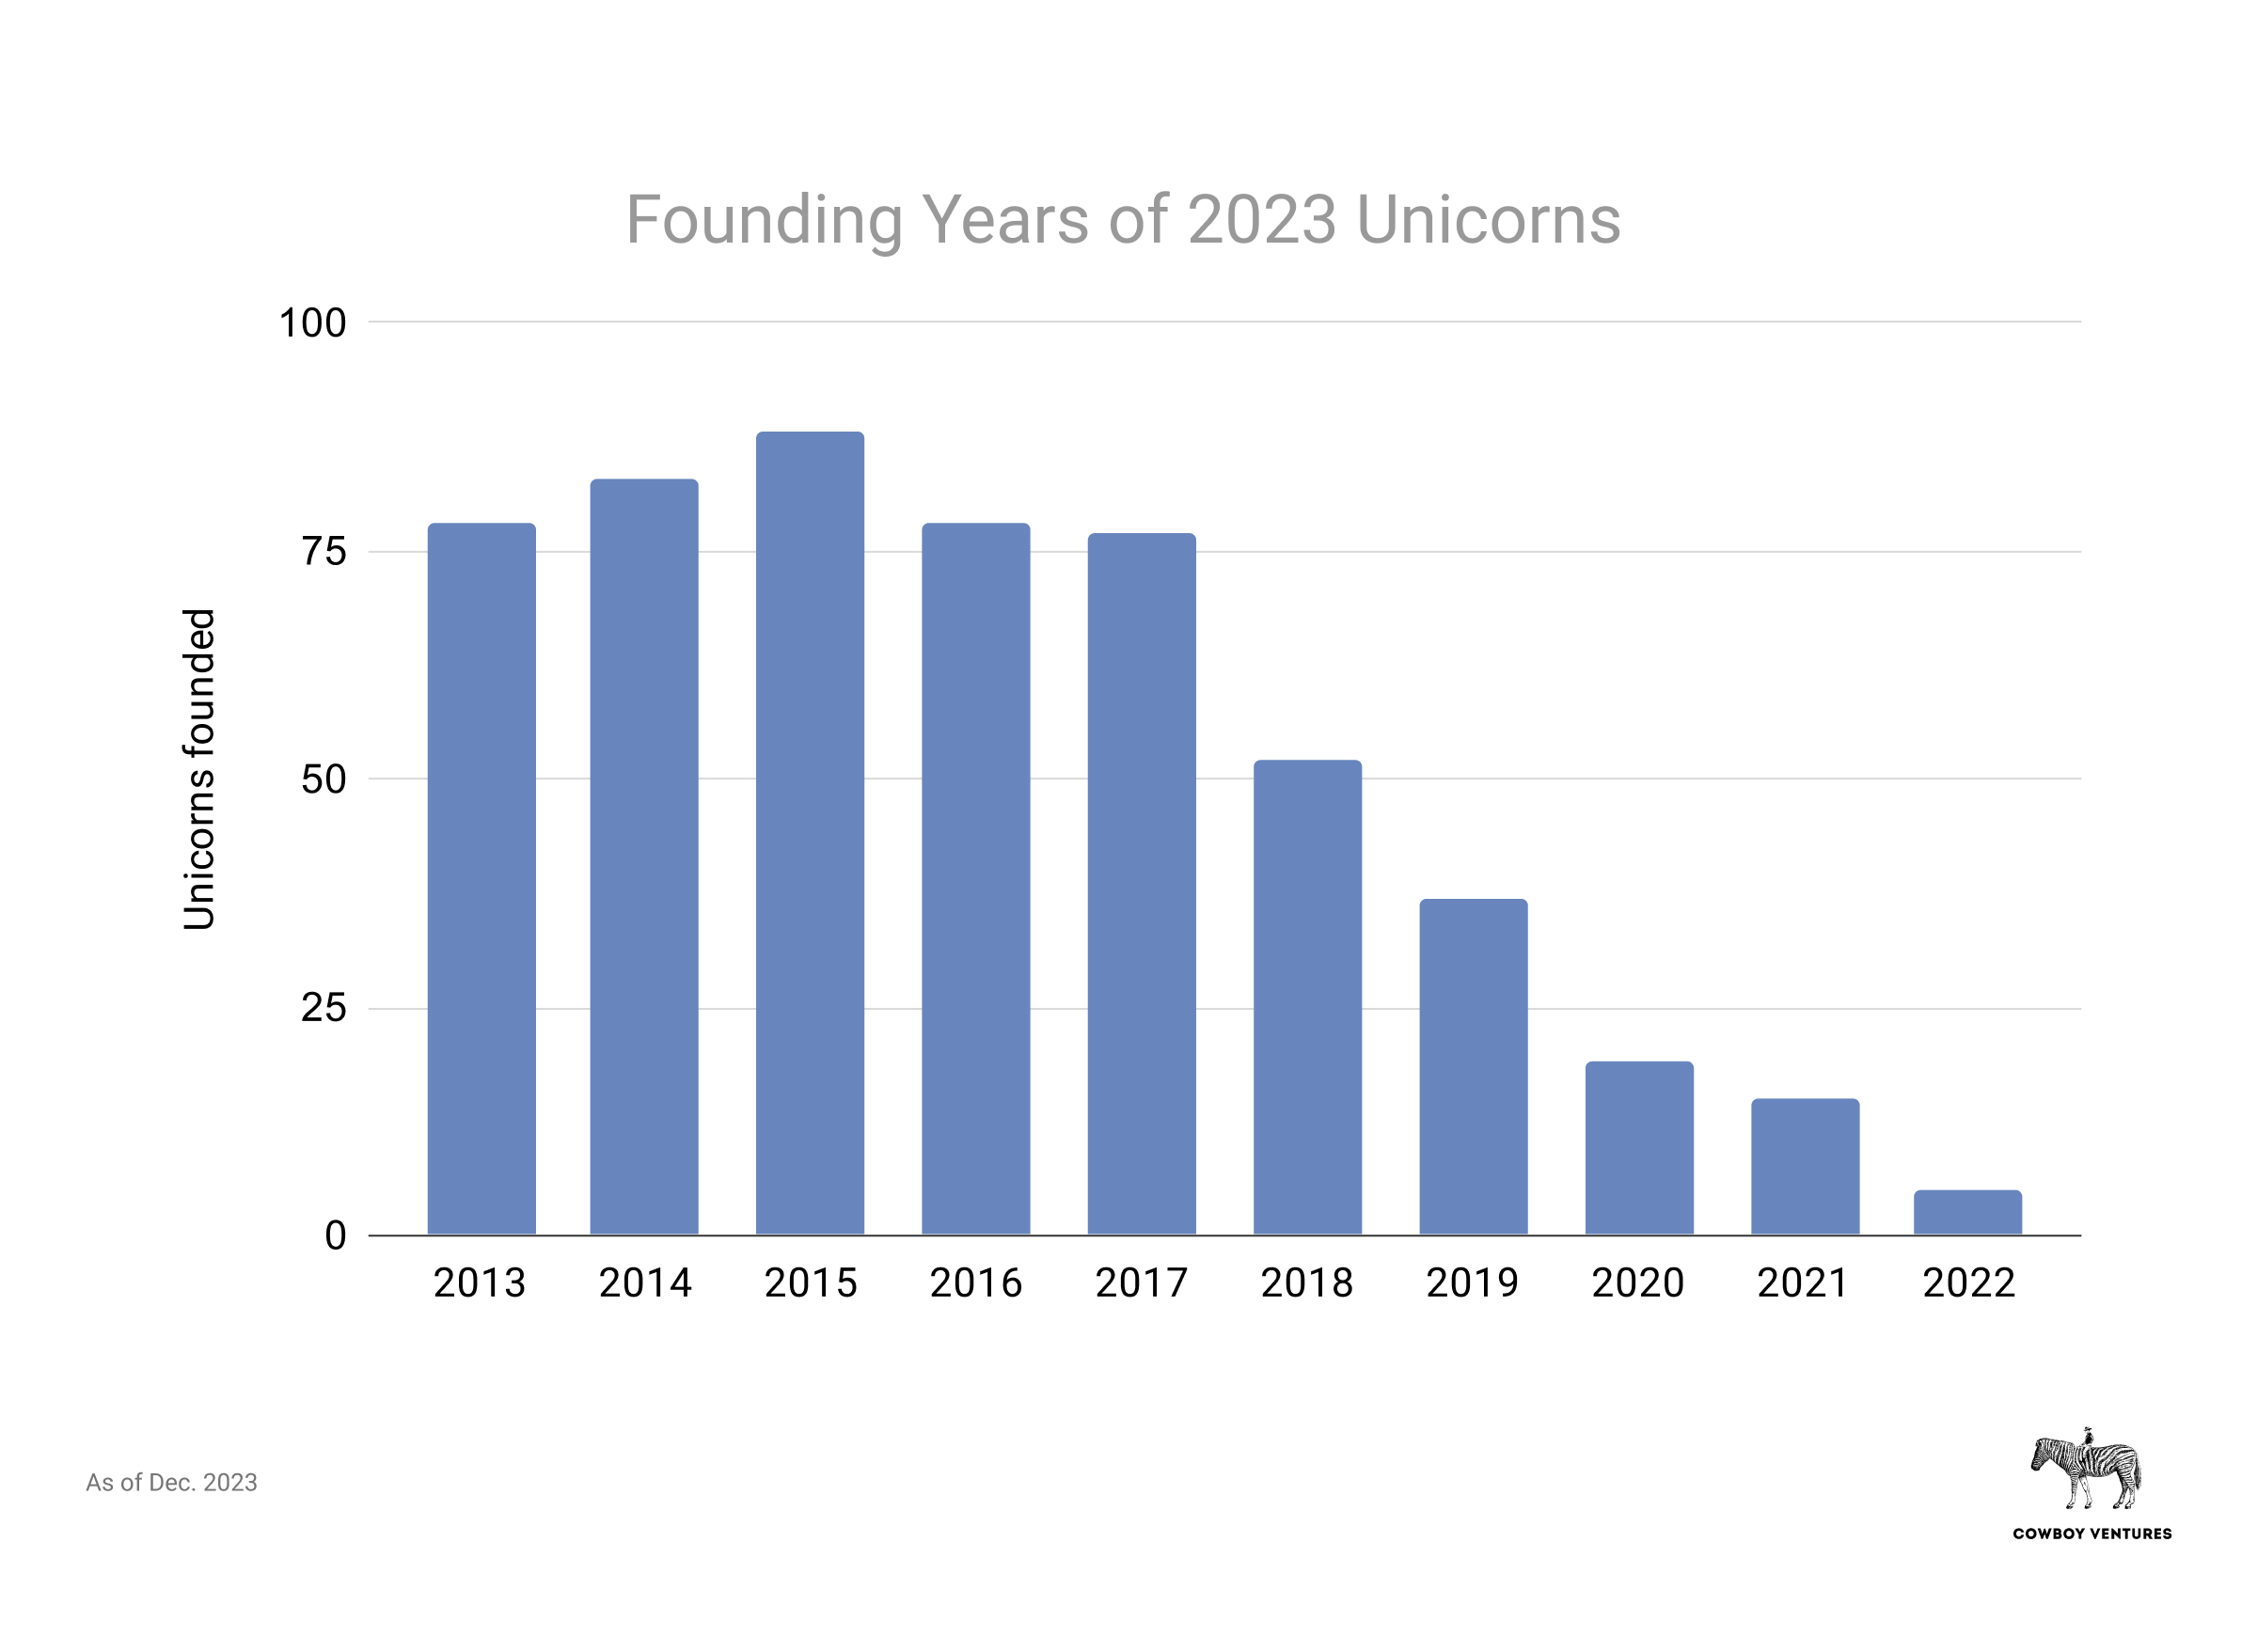
Companies of all ages became unicorns in the run-up. Image Credits: Cowboy Ventures
Unlike in our 2013 analysis, there were no best years for founding a unicorn: 2020 and 2021 accelerated the “crowning” of all ages and stages of companies. Today’s unicorns are seven years old on average, same as a decade ago, which seems like a good thing.
We don’t analyze fallen unicorns here. But anecdotally, we see being crowned a unicorn too quickly could be a curse. Fallen unicorns like Hopin and Bird were crowned within one year of founding; car leaser Fair in two years; and Convoy and Knotel just three years after founding.
The pendulum swung hard to enterprise
Enterprise companies are worth $1.2 trillion, 80% of aggregate value. Image Credits: Cowboy Ventures
Ten years ago, we found just 15 (38%) unicorns building B2B software and services comprising just $55 billion in total value. Workday, ServiceNow, Splunk and Palantir were the most valuable enterprise unicorns at the time.
Today, there are 416 enterprise unicorns — making up around 78% of the list — worth $1.2 trillion and driving 80% of aggregate value (versus 20% in 2013).
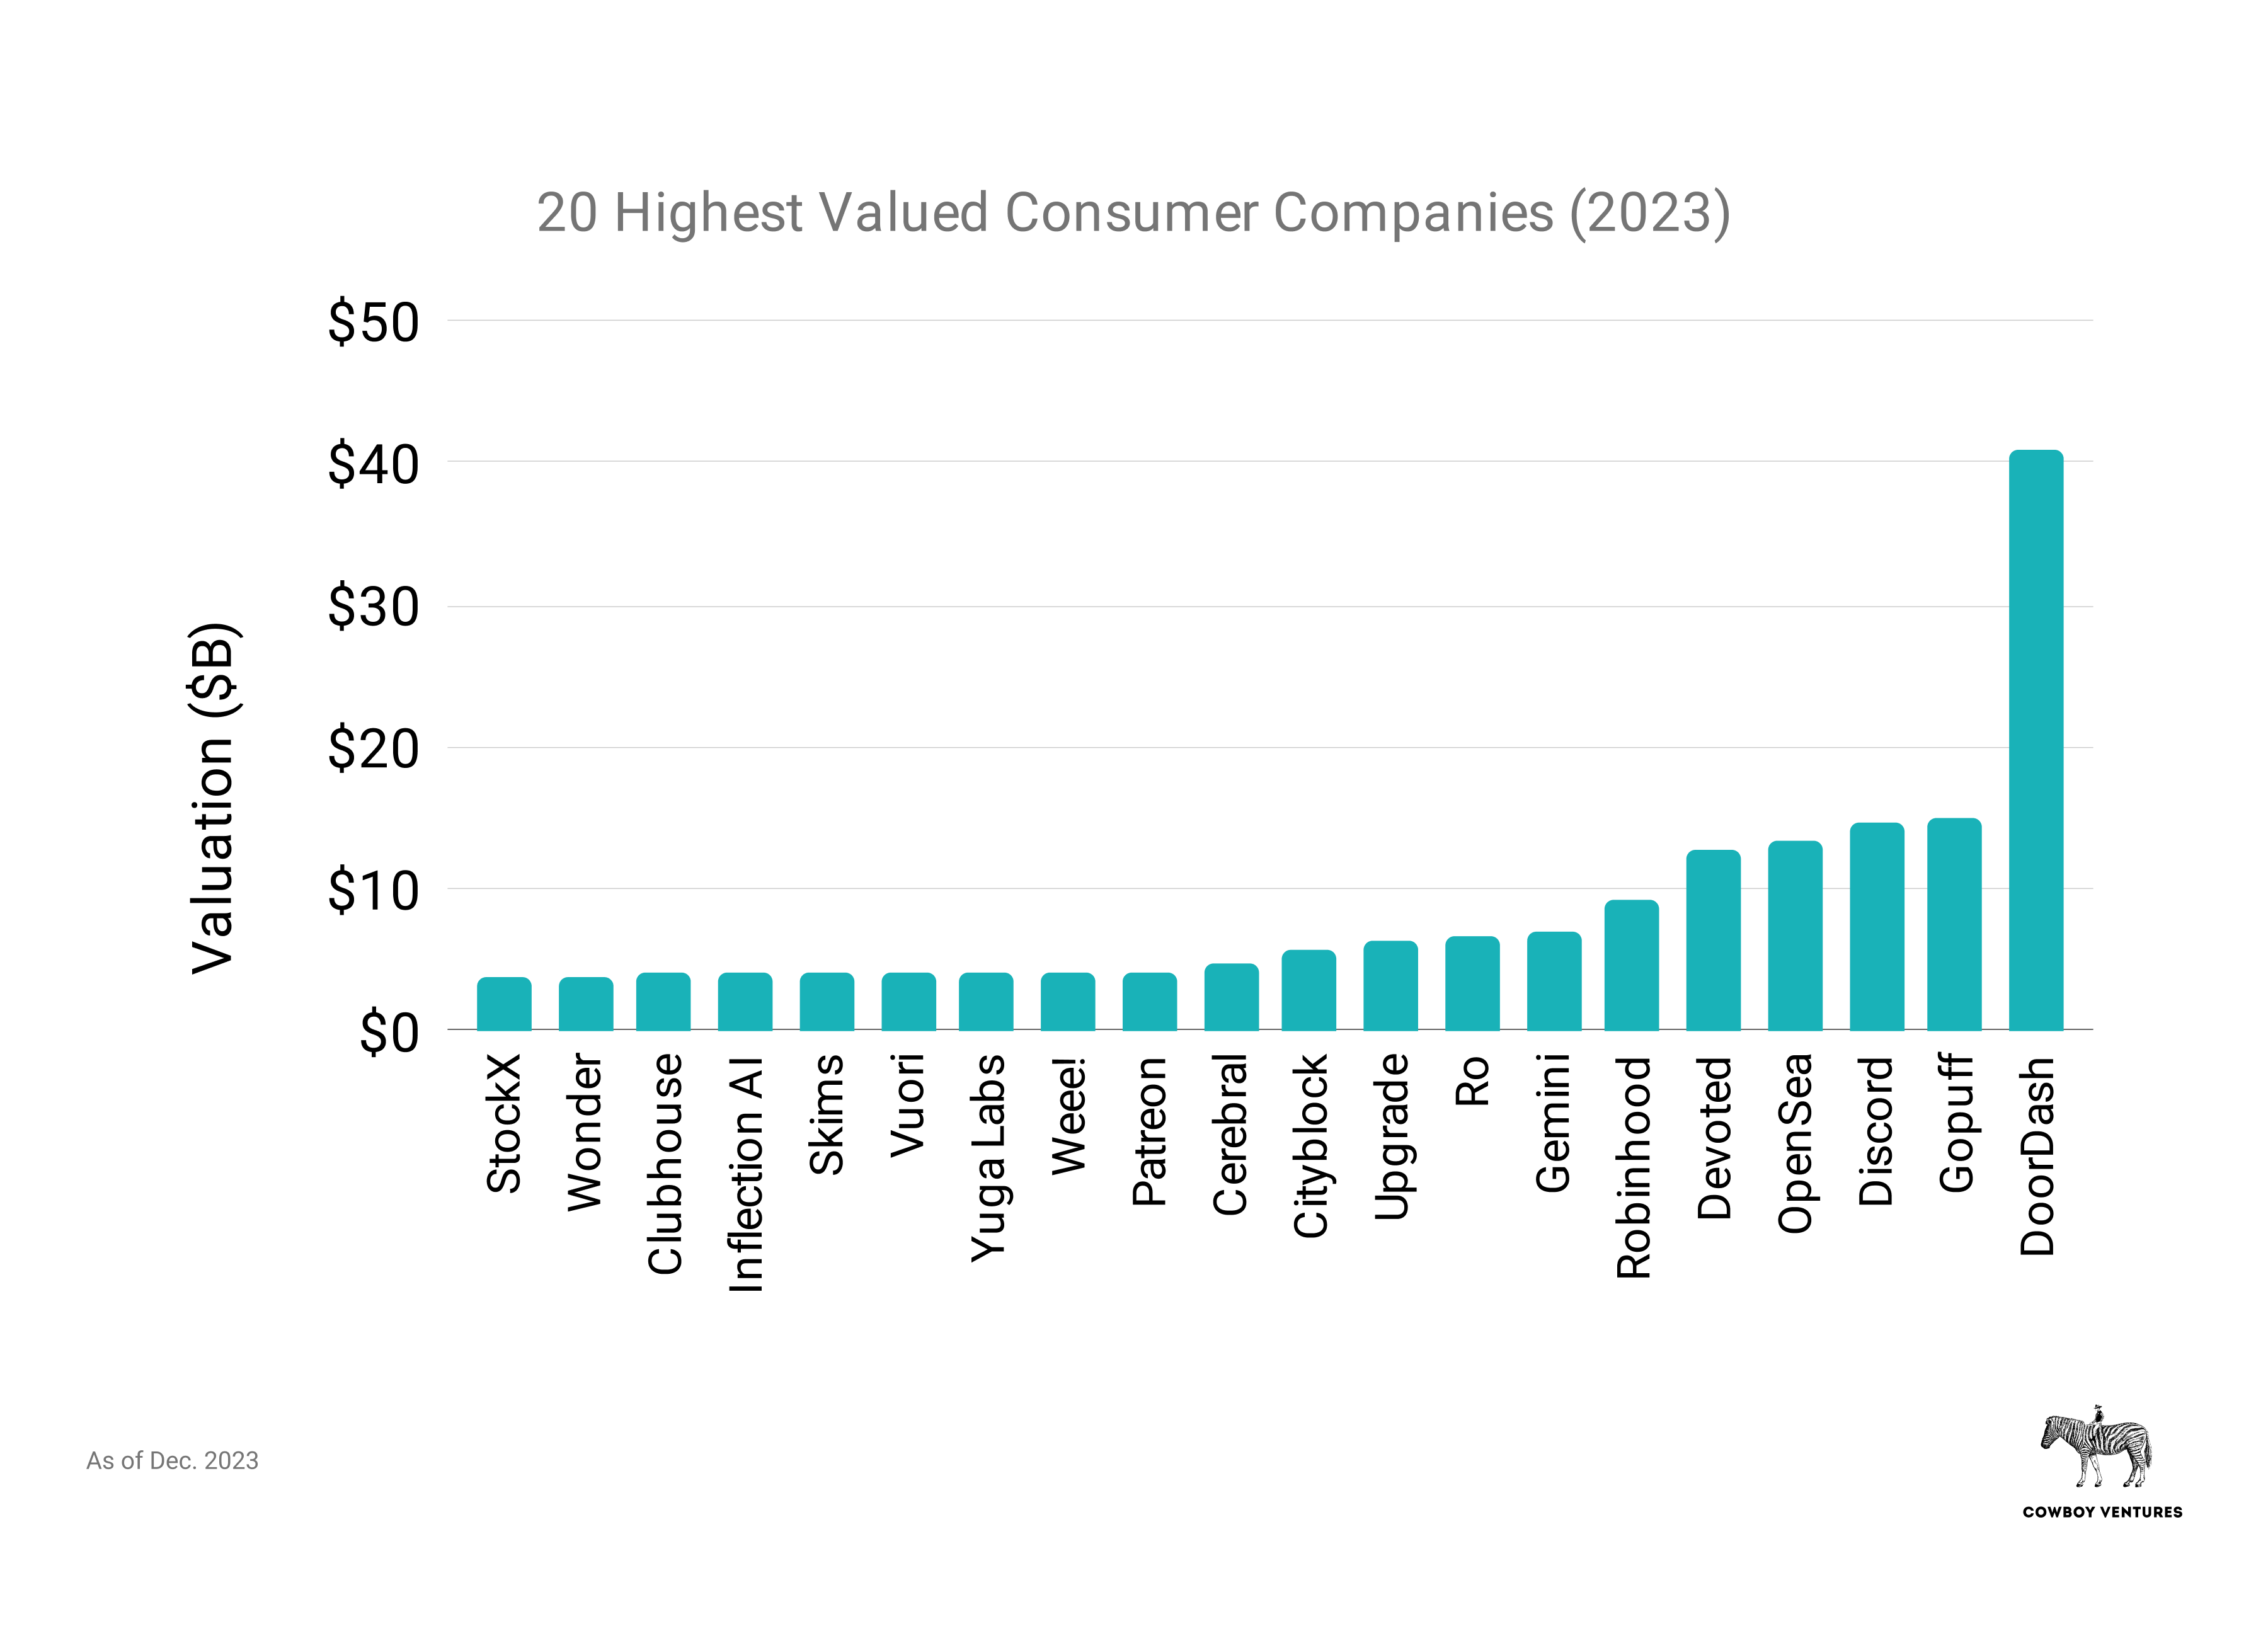
Consumer companies comprise 20% of our list. Image Credits: Cowboy Ventures
Consumer companies today make up 20% of aggregate value, a big contrast to the 80% they accounted for back in 2013. Remember “SoMoCo”? Social (Facebook, Twitter, Pinterest), mobile (Uber, Square) and e-commerce (Groupon, Gilt, Fab).
The most valuable consumer startups today operate in areas like last-mile delivery (DoorDash, Gopuff), health (Devoted, Ro, Cityblock), and gaming-driven platforms (Discord, Rec Room) — companies that drove new habits during COVID.
What caused so much capital to flock to enterprise companies in the past decade? The attraction of historical capital efficiency, the predictability of SaaS business models (high gross margin and customer retention), and a growing number of highly valued potential acquirers were likely a big draw. Global adoption of cloud made it easier to adopt new software and opened a big window for a whole new ecosystem of application layer, infrastructure, data and analytics, and security companies.
The cyclical pendulum does swing, so given the hard shift to enterprise, we hope and expect more exciting consumer unicorns will be born in coming years. For inspiration, many of today’s leading consumer internet experiences are about two decades old (eBay, Expedia, OpenTable, Tripadvisor, StubHub, Yelp), possibly fertile territory?
A bloated herd
Our 532 companies are a wobbly, bloated herd that will thin in the coming years to around 350. That’s because a whopping 93% of unicorns are actually “papercorns”: privately valued on paper but not yet “liquid.” It’s a big change from just 36% private unicorns in 2013.

A spate of ZIRPicorns was crowned when rates troughed. Sources: PitchBook, Federal Reserve Economic Data. Note this includes all VC-backed companies valued at $1 billion for the first time in a given year, including those founded before 2013. Image Credits: Cowboy Ventures
Sixty percent of unicorns today are what we call “ZIRPicorns”: They were last valued between January 2020 and March 2022, which saw peak public multiples and near-zero interest rates.
When money was flowing, unprofitable private companies were often able to raise enough to fund two to five years of operations. This means that operating runways are getting short for many unicorns. Many are working to get profitable on existing cash, which is challenging given the current economy and is even harder when starting with a lower gross margin business.
Given the chilly current M&A environment, founders’ resistance to recapitalization, and investors’ fear of “catching a falling knife” by investing in a down round, we expect more abrupt shutdowns in 2024 (e.g., Convoy, Olive Health, Zume) (“unicorpses,” anyone?).
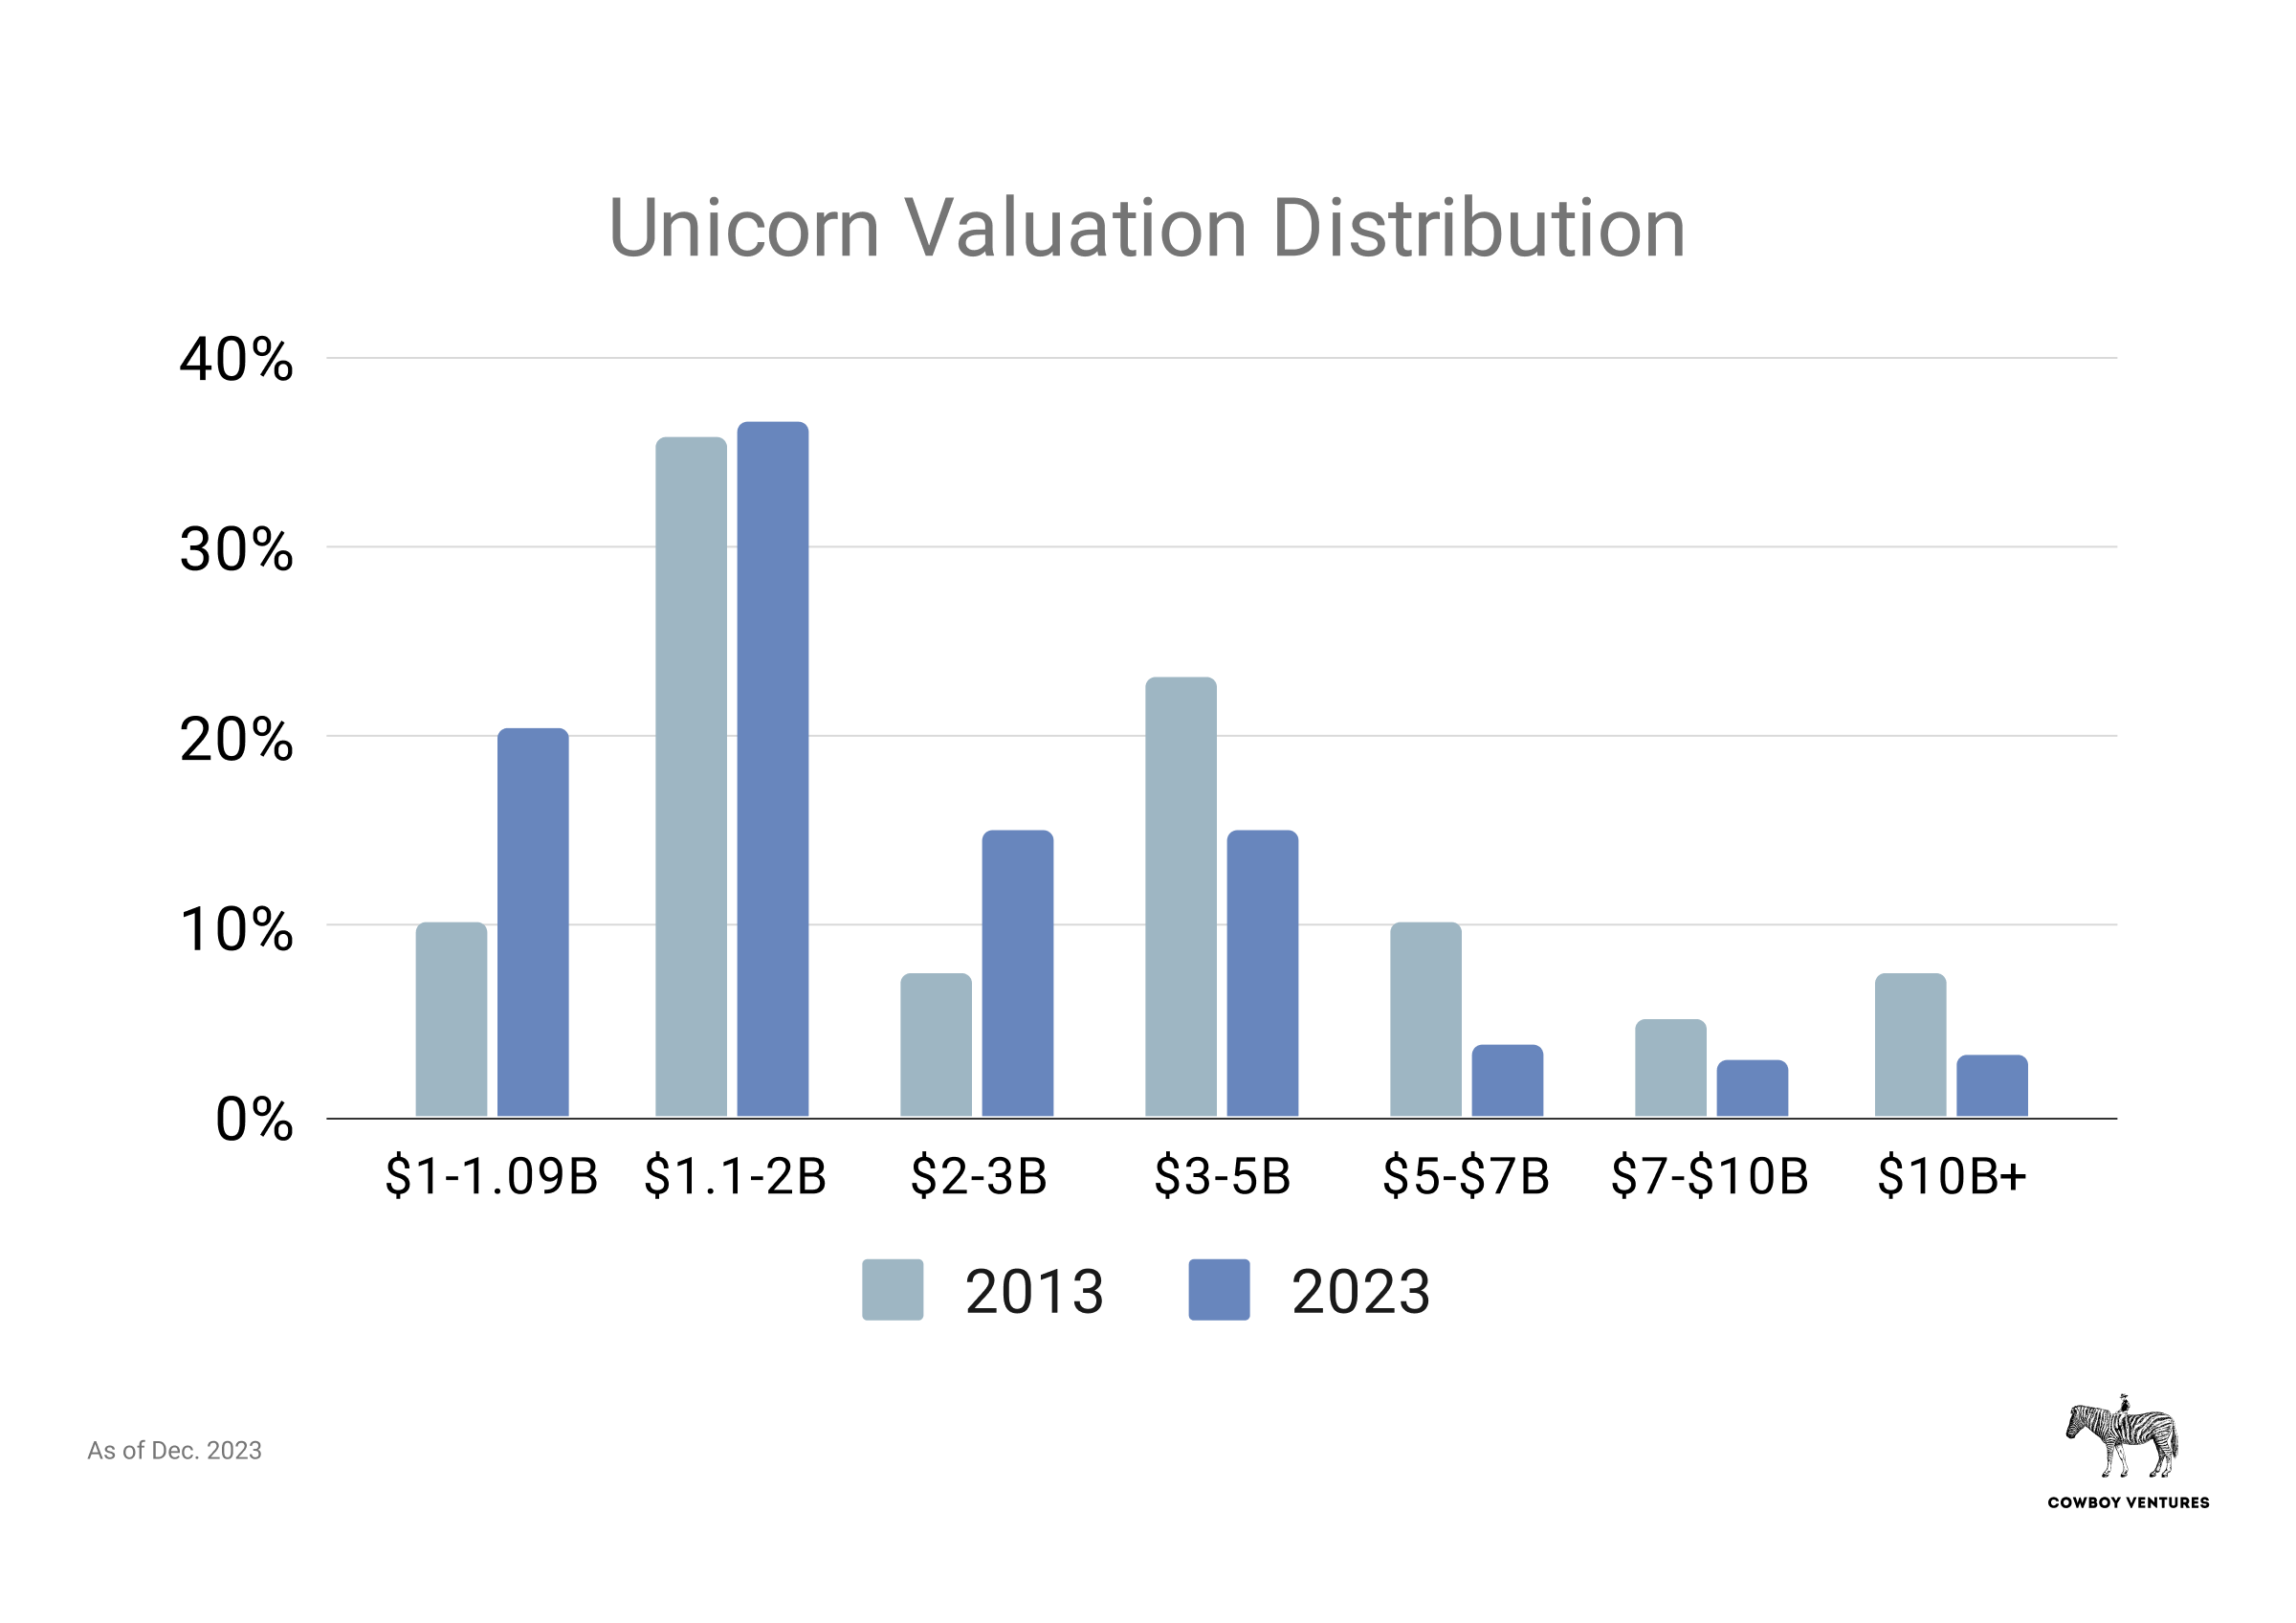
Valuations skew lower in this herd, and many are on the cusp of being a unicorn. Image Credits: Cowboy Ventures
Coining the term also seems to have affected the market (sorry!): 21% are valued at $1 billion (versus 10% in 2013), on the cusp of being a “unicorn,” and 46% at less than $2 billion.
Around 40% are trading below the $1 billion valuation mark in secondary markets, according to real order data for 290 unicorns on our list from Hiive. It’s possible more might trade at less than $1 billion.
On the bright side, we see approximately 350 healthy businesses of substance in this herd — almost 10x in a decade! Many ZIRPicorns and papercorns raised enough capital and are successfully navigating the new climate, and will grow into and beyond their current valuations. Many will become public companies in the coming years, with rock-solid financials, tested by the downturn. And a few of these companies will grow to become superunicorns.
And, we see evidence of a Software Unicorn Power Law.

An echo of Moore’s law? Unicorn growth tracks compute power growth. Source: Our World In Data, plus PitchBook’s list of total U.S.-based private unicorns (including those founded before 2013). Note this chart is for illustrative purposes. Image Credits: Cowboy Ventures
The number of unicorns increased at an amazing 30% on average every year in the past decade, spurred by enterprise software spend, consumer tech adoption, VC funding and interest rates.

Image Credits: Cowboy Ventures
We see an echo of Moore’s law here: As compute capacity, capability and usage increase, the number of unicorns increases. The current momentum in AI should add fuel to innovation and demand.
Adjusting the current herd to 350, future unicorn growth to a less bubbly 15%, and improving current capital efficiency a bit, we see 4x more, or about 1,400 U.S. unicorns, in 2033. Counterarguments to this line of thinking include scarcer venture capital, higher interest rates and software consolidation. But previous downturns have been fertile for unicorn founding. This will be exciting for the future of innovation, jobs and the tech economy, despite current conditions.
The exclusive “liquid unicorn” club
There have been few exits: only 7% versus 66% in the prior decade. Just 35 of 532 unicorns are public or were acquired for over $1 billion, a consequence of increased private capital and a more challenging regulatory and M&A environment. The average time from founding to an IPO or acquisition was a speedy six years, and an impressive 75% of founding CEOs led their companies from founding through an exit.

Just 14 of 532 unicorns are public today. Image Credits: Cowboy Ventures
The public unicorn club is elite, with just 3% public compared to 41% going public the decade prior. That’s a huge change, partly driven by the availability of so much private capital and investors willing to invest in richer-than-public valuations in the last decade.
These companies are split between enterprise and consumer and span a wide array of sectors.
It’s also notable that around 70% of the current public unicorns’ CEOs were the founding CEOs. So many leaders scaling from being a startup founder and individual contributor to leading and managing a multi-billion-dollar public company is impressive!

Just a sample of formicorns’ struggle in public markets, many spurred by SPACs. Image Credits: Cowboy Ventures
Reflecting the times, there are more fallen public unicorns than healthy public unicorns in this herd. At least 20 unicorns went public in the last decade, then fell below $1 billion in value (hello, SPACs), versus just 14 current public unicorns. (These, and companies previously valued at less than $1 billion but subsequently acquired or recapitalized at a lower valuation, are not included in our analysis.)
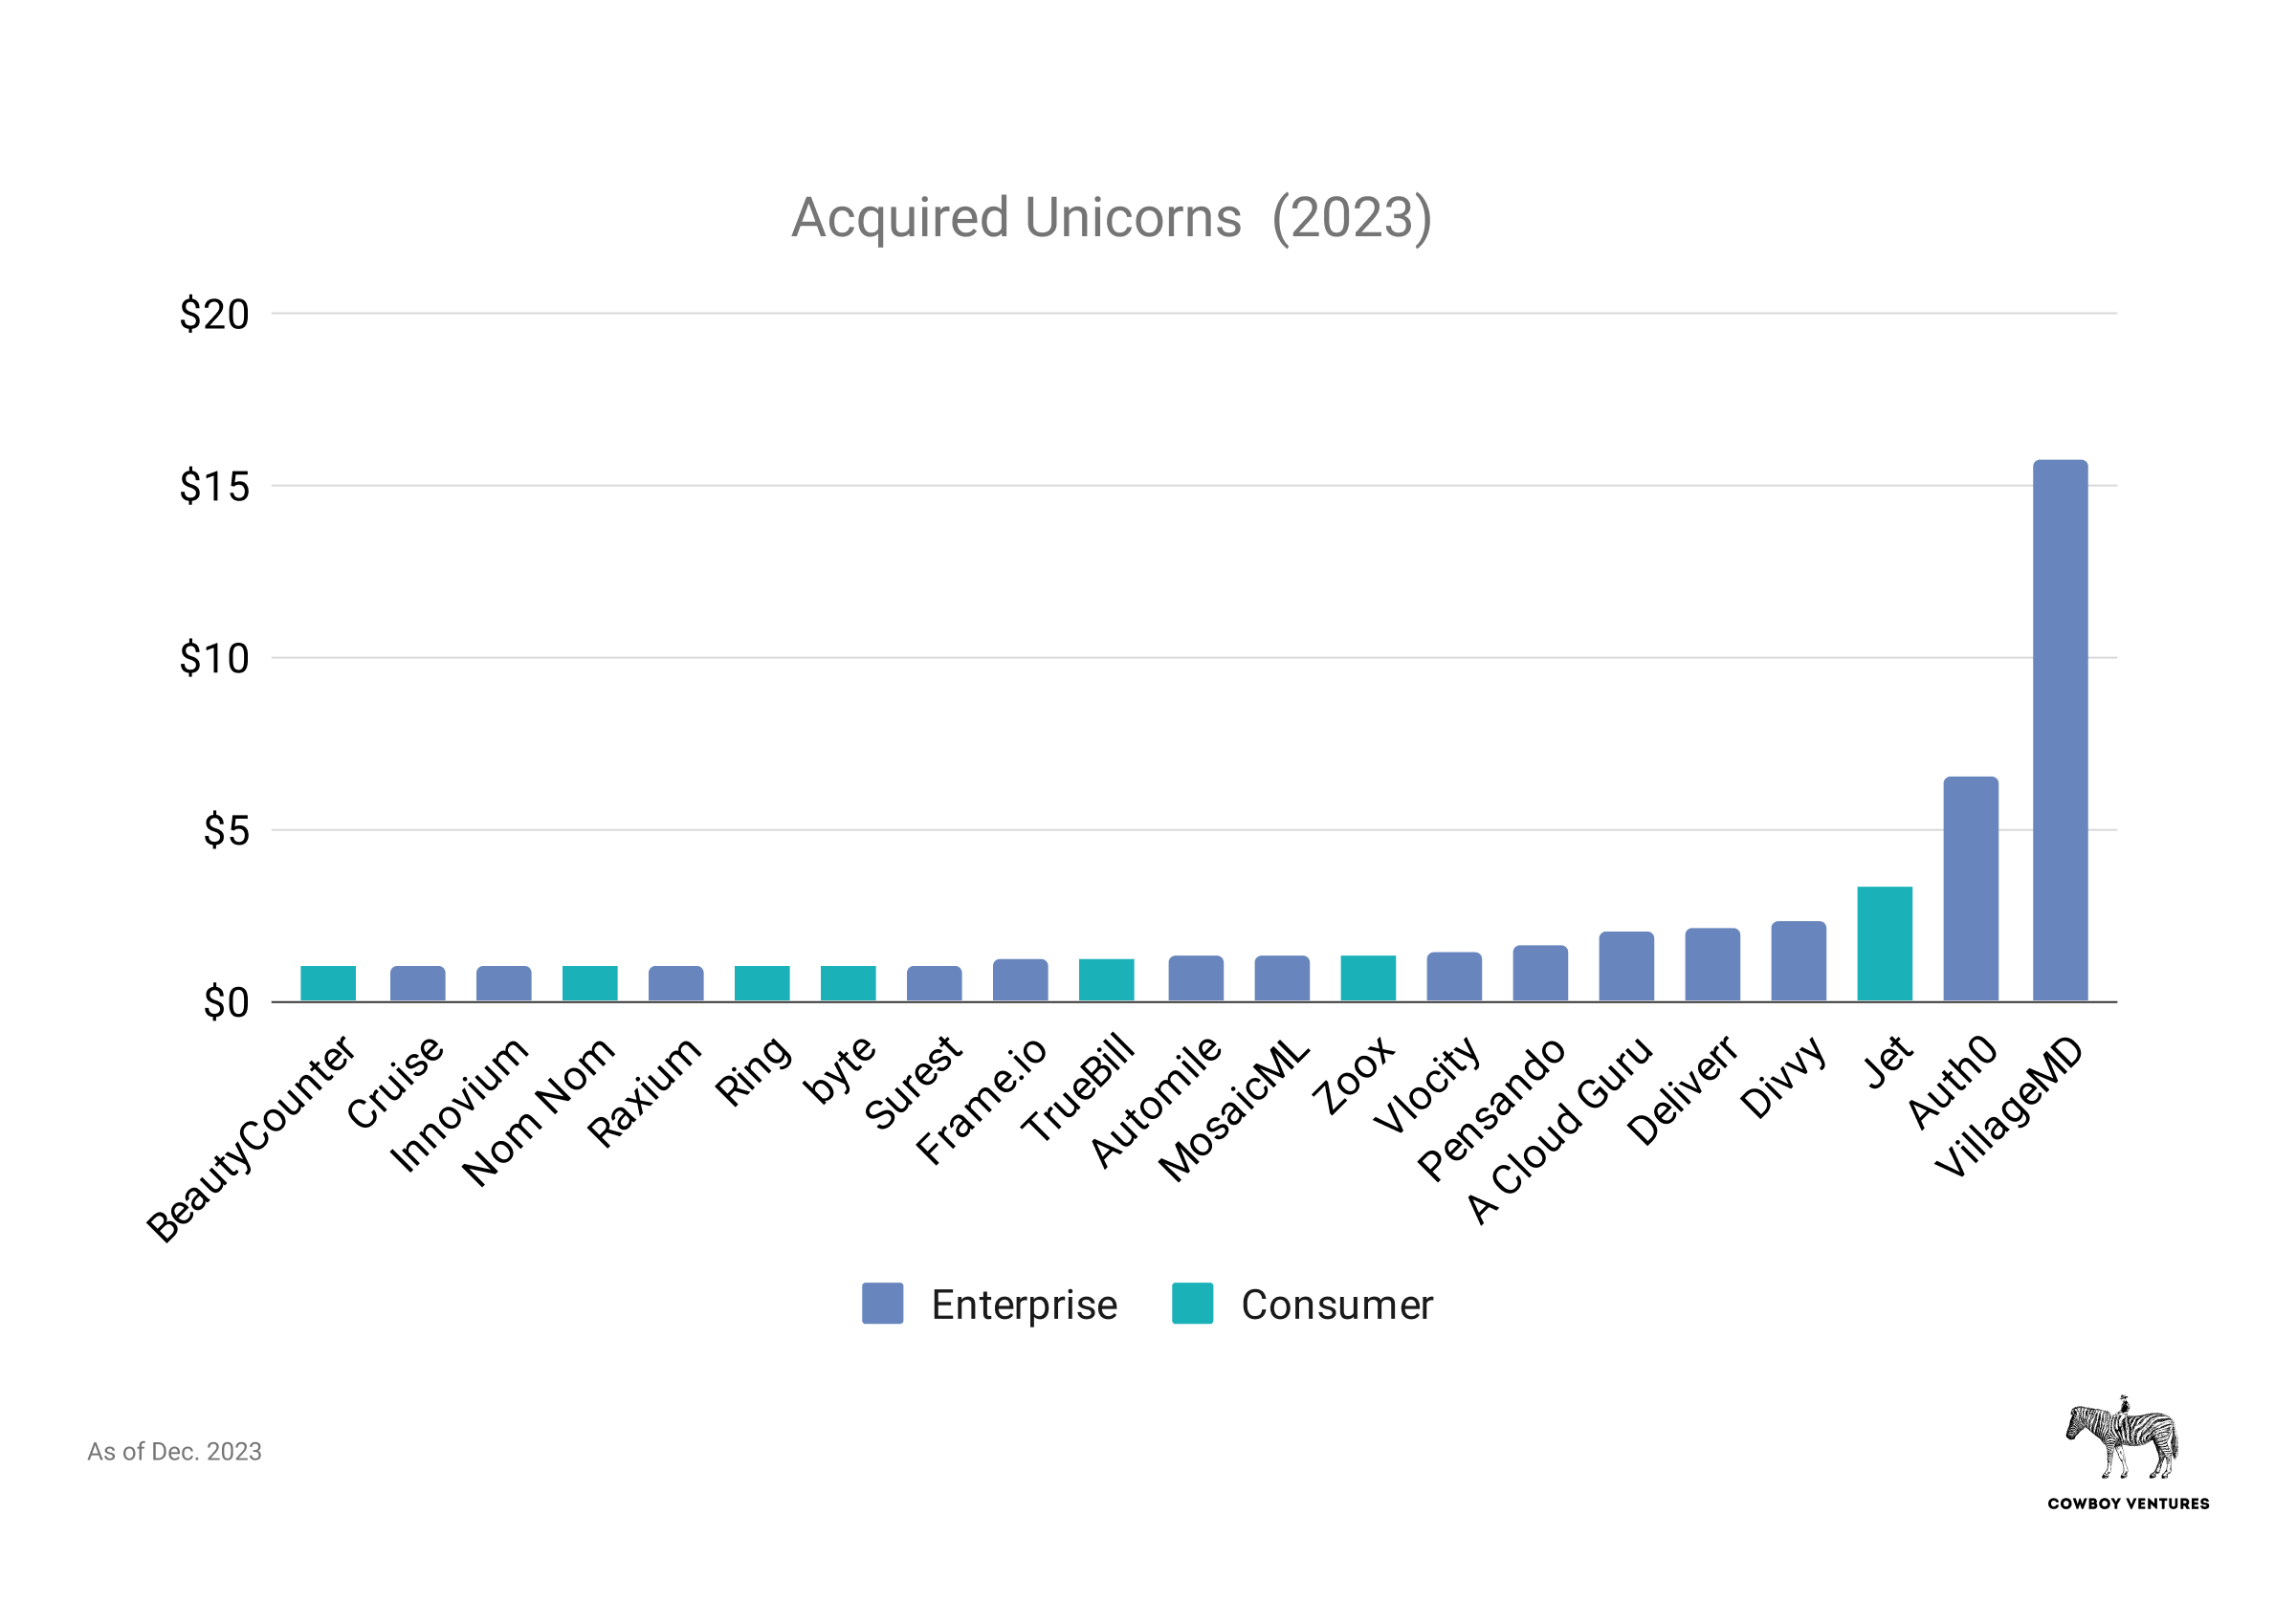
A paltry 4% of 2023 unicorns had an “exit” via acquisition vs. 23% in 2013. Image Credits: Cowboy Ventures
Just 21 companies were acquired, spanning a diverse set of sectors: Two-thirds were in enterprise and the rest consumer. The average acquisition price was $2.4 billion, about 2x that of 2013. Notably, 33% of these deals involved hardware companies (Cruise, Raxium, Ring, Zoox, etc.), likely a consequence of low interest rates for both unicorns and acquirers.
Capital efficiency declined significantly
Unicorn capital efficiency dropped significantly over the last 10 years — precipitously for enterprise companies. This will be bad for exits, venture returns, founders and employees.

Capital efficiency plummeted among enterprise unicorns. Image Credits: Cowboy Ventures
The most successful VC-backed tech companies have historically delivered outsized returns. Delivering a 26x return within 10 years is outstanding (about 40% IRR), but investors (and talent) have to risk years of illiquidity versus other asset classes or industries.
In the past decade, tech has lost its capital efficiency edge. Enterprise companies’ formerly impressive capital efficiency of 26x plummeted to 7x, putting it in line with consumer companies’ efficiency (despite typically higher margins and customer retention), which also dropped from 11x to 7x. Given that many unicorns are currently overvalued, even 7x is likely inflated.
In other words, investors would have been better off investing in public superunicorns like Salesforce, Amazon, and Microsoft (up 8x, 9x, and 9x, respectively) than in many companies in our current unicorn herd.
Let’s use an example to illustrate capital efficiency as we define it: current valuation divided by private capital raised.
- Let’s say a company has raised $600 million in preferred stock rounds plus $100 million in debt.
- With strong customer traction and a magnetic CEO, in 2021 the company grows to run-rate revenue of $100 million and raises capital at a $3 billion valuation, mirroring the 30x multiples of high-growth public comparable companies.
- Employees get common options at 50% the preferred price — a $1.5 billion valuation.
- Then comes 2022. Churn skyrockets and new sales dry up. The company reduces its headcount from 1,000 to 500 over several waves of layoffs. The team fights like hell and gets back to $100 million ARR by 2025, and almost reaches breakeven.
- In 2025, the company is offered a $500 million acquisition offer by a private equity firm, or 5x its revenue, the current public market comparable.
- The management takes the deal, agreeing to an 8% “carveout” for themselves ($20 million) and employees ($20 millions) as stock options are “underwater.” Debtors get paid in full, investors get about 60% of their investment back, and employees who stay with the company get about $30,000 at exit after four to 10 years of work.
- The company’s capital efficiency is 0.83x ($500 million/$600 million equity raised).
Interest rates again had a big impact here: As rates fell, investors maintained confidence in historical venture returns, while competition grew for allocation in hot deals. This caused many to overlook valuations, business model margins, payback periods and burn rates as they invested.
For the startup industry to once again deliver outsized returns, we have to regain capital efficiency discipline.

Shoutouts to highly capital efficient companies (with caveats). Image Credits: Cowboy Ventures
The above chart highlights highly capital-efficient companies, with caveats. The vast majority of these are “papercorns,” so this list does not reflect realized capital efficiency. Cruise’s efficiency is based on its $1 billion acquisition by GM in 2016 after being founded in 2014. The company has raised billions more since as a GM subsidiary, which paints a very different picture of its current efficiency.
In our 2013 analysis, Workday and ServiceNow were standouts, with capital efficiency of 60x each. Their market caps are also 5x and 19x higher now, respectively.

Some 2023 unicorns are currently worth <2x capital raised. Image Credits: Cowboy Ventures
If you’re looking for evidence that companies raised too much in the past decade, about 20% of companies on our list are worth less than 4x their capital raised. Given how many are likely overvalued, reality will likely be worse than this. The categories with the lowest average capital efficiency were climate/energy, real estate, and healthcare.
OpenAI is likely to become the decade’s superunicorn, and AI the megatrend
The previous major waves of tech innovation have each crowned a superunicorn that grows to be worth more than $100 billion over time, like Microsoft, Cisco, Amazon, and Meta. (Meta is the only one to be crowned within the last 10 years.)
OpenAI is close to being the first AI superunicorn, rumored to be raising at a valuation of more than $100 billion, at just eight years old.
At times over the past 10 years, crypto looked like it could be the mega-trend of the decade. Coinbase hit a market cap of $76 billion in November 2021 after going public months earlier; it’s now worth about $32 billion (because Coinbase was founded in 2012, it is not included in this dataset).

Superunicorns grew superpowers, 2013–2023. Image Credits: Cowboy Ventures
There are now 15 VC-backed superunicorns, and they got a lot more valuable over the last decade. Meta was worth $122 billion in 2013 and is worth about $950 billion, or 8x, today.
Superunicorns have superpowers that help create and/or disrupt entire categories — like Netflix (worth more than Comcast, Paramount, and Warner Bros. combined) and Tesla (worth more than the next five largest public automakers combined).
Of our original dataset, three more became superunicorns in recent years: ServiceNow, Uber, and Palo Alto Networks. And Airbnb is on the horizon at $88 billion. They’ve grown to be worth more than Hyatt and Marriott combined and have the benefit of network effects.
Superunicorn power may compound further in the coming years, with software consolidation and tighter capital constraints for smaller-scale players.
The herd spreads beyond the Bay
The Bay Area gained in numbers but lost ground as the home of unicorns as other hubs grew.
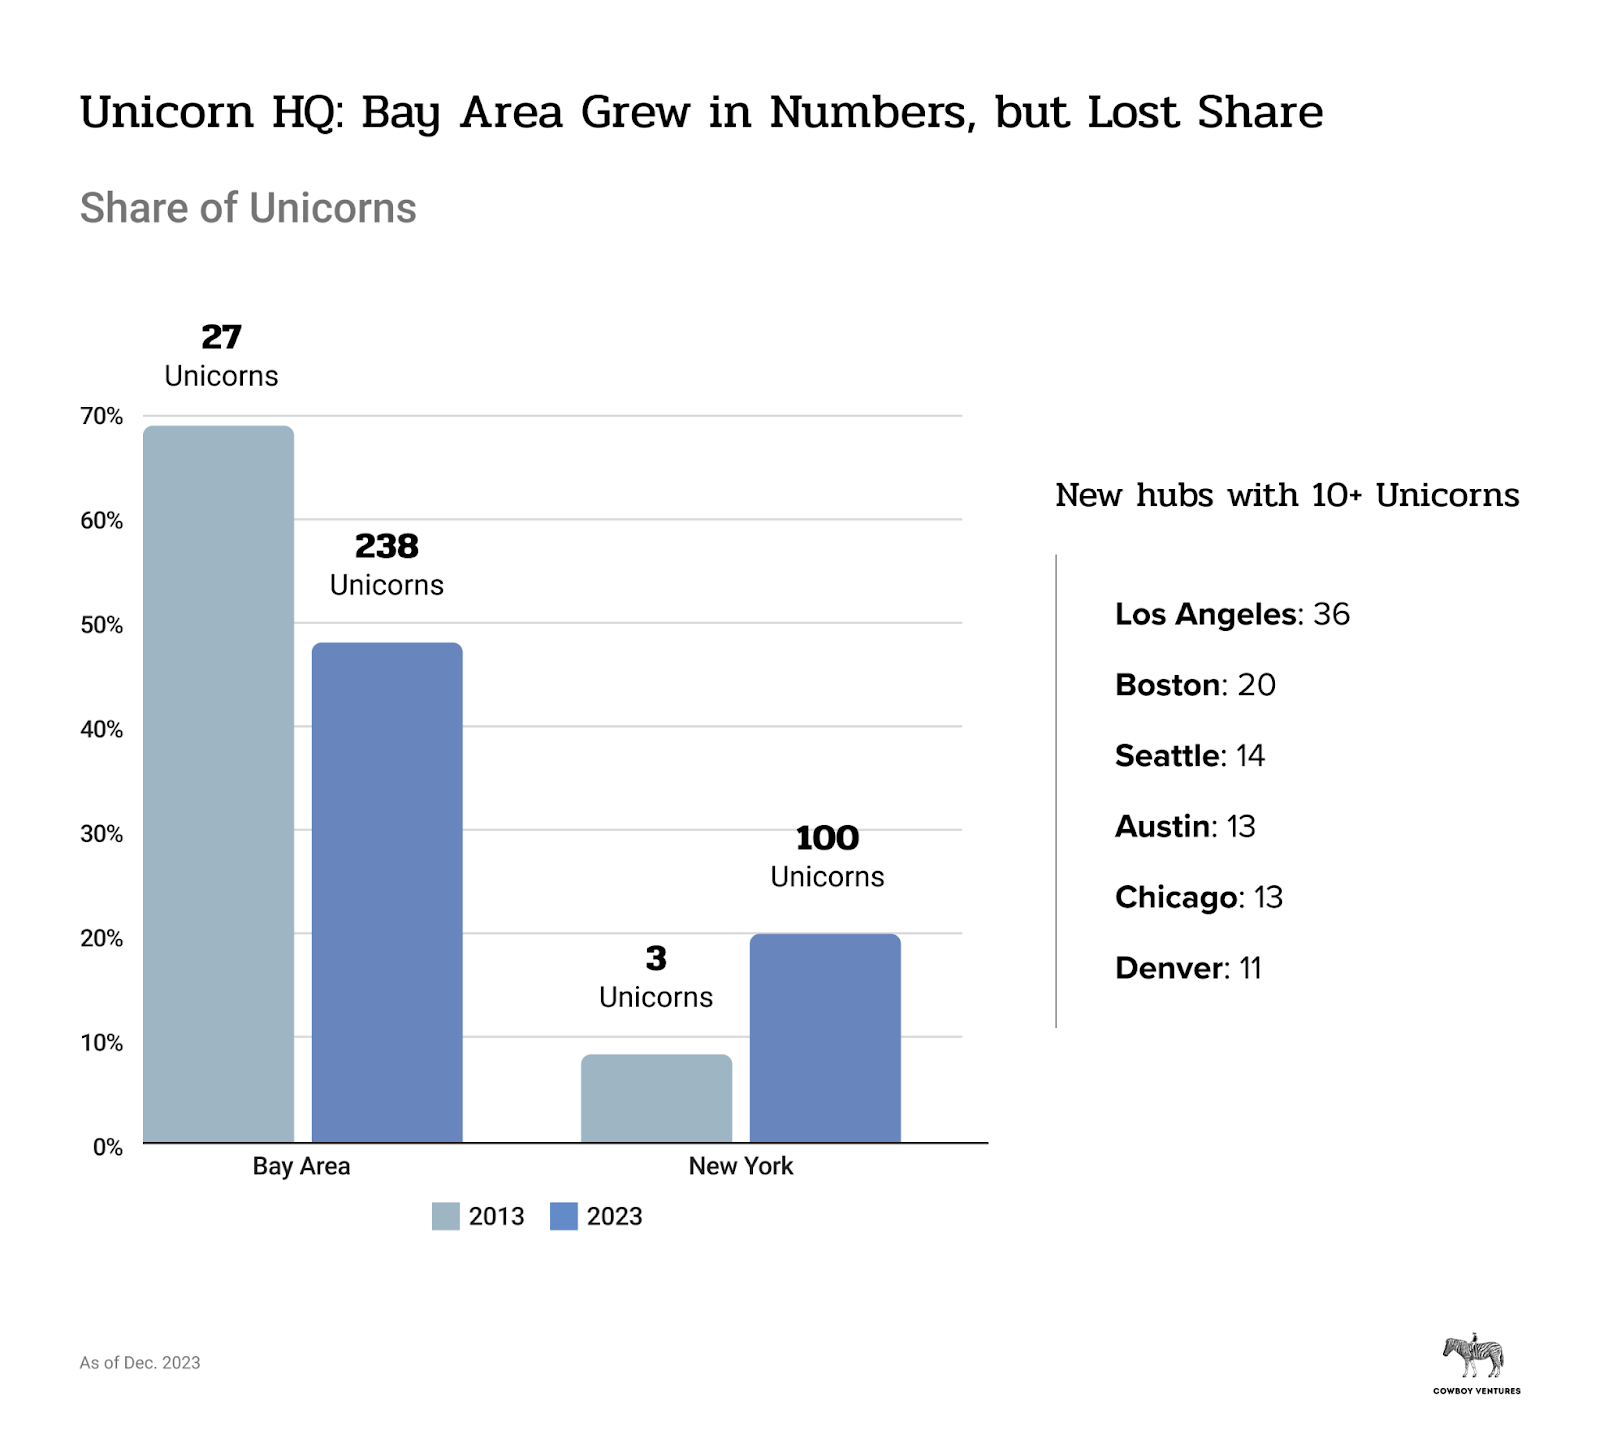
COVID effects likely helped spread more unicorns across the country. Image Credits: Cowboy Ventures
The significance of geography continues to evolve, given COVID-era effects. Many unicorns are now spread across multiple cities and offer a hybrid work environment to employees. Notably, at least 22 have no physical HQ office, according to Flex Index data. But there are clear economic and local network effects to geographical unicorn hubs. Many CEOs cite productivity, creativity and cultural gains from in-person work, relevant for hopeful future unicorns.
The Bay Area is still the largest unicorn pasture, but it lost a lot of ground, from being home to 69% of unicorns in 2013 to 45% in 2023. On the bright side, it’s home to 238 unicorns (including the four most valuable: OpenAI, Databricks, DoorDash, and Samsara), 9x more than in 2013.
It’s unclear whether the Bay Area will regain its stature as unicorn central. A lot may depend on return-to-work policies, the importance and concentration of AI talent, and the quality and cost of living compared to other hubs, as well as the next generation of unicorns.
New York’s share grew a lot (11% to 19%) as the second-largest hub. The city is now home to 100 unicorns (about 40% are crypto/web3 or fintech, including OpenSea and Chainalysis).
Many geographies grew from having no or few unicorns to becoming HQ to more than 10: Los Angeles (CloudKitchens, Blockdaemon); Boston (Devoted Health, Circle); Seattle (Auth0, Outreach); Austin (Everlywell, Workrise); Chicago (VillageMD, Tegus); and Denver (Guild, Crusoe).
More unicorns, more founders! But some things didn’t change at all
More unicorns spread across more geographies, and founders now hail from a broader variety of backgrounds. Using publicly available information and data from People Data Labs, our list grew to more than 1,300 founders versus around 100 in 2013.
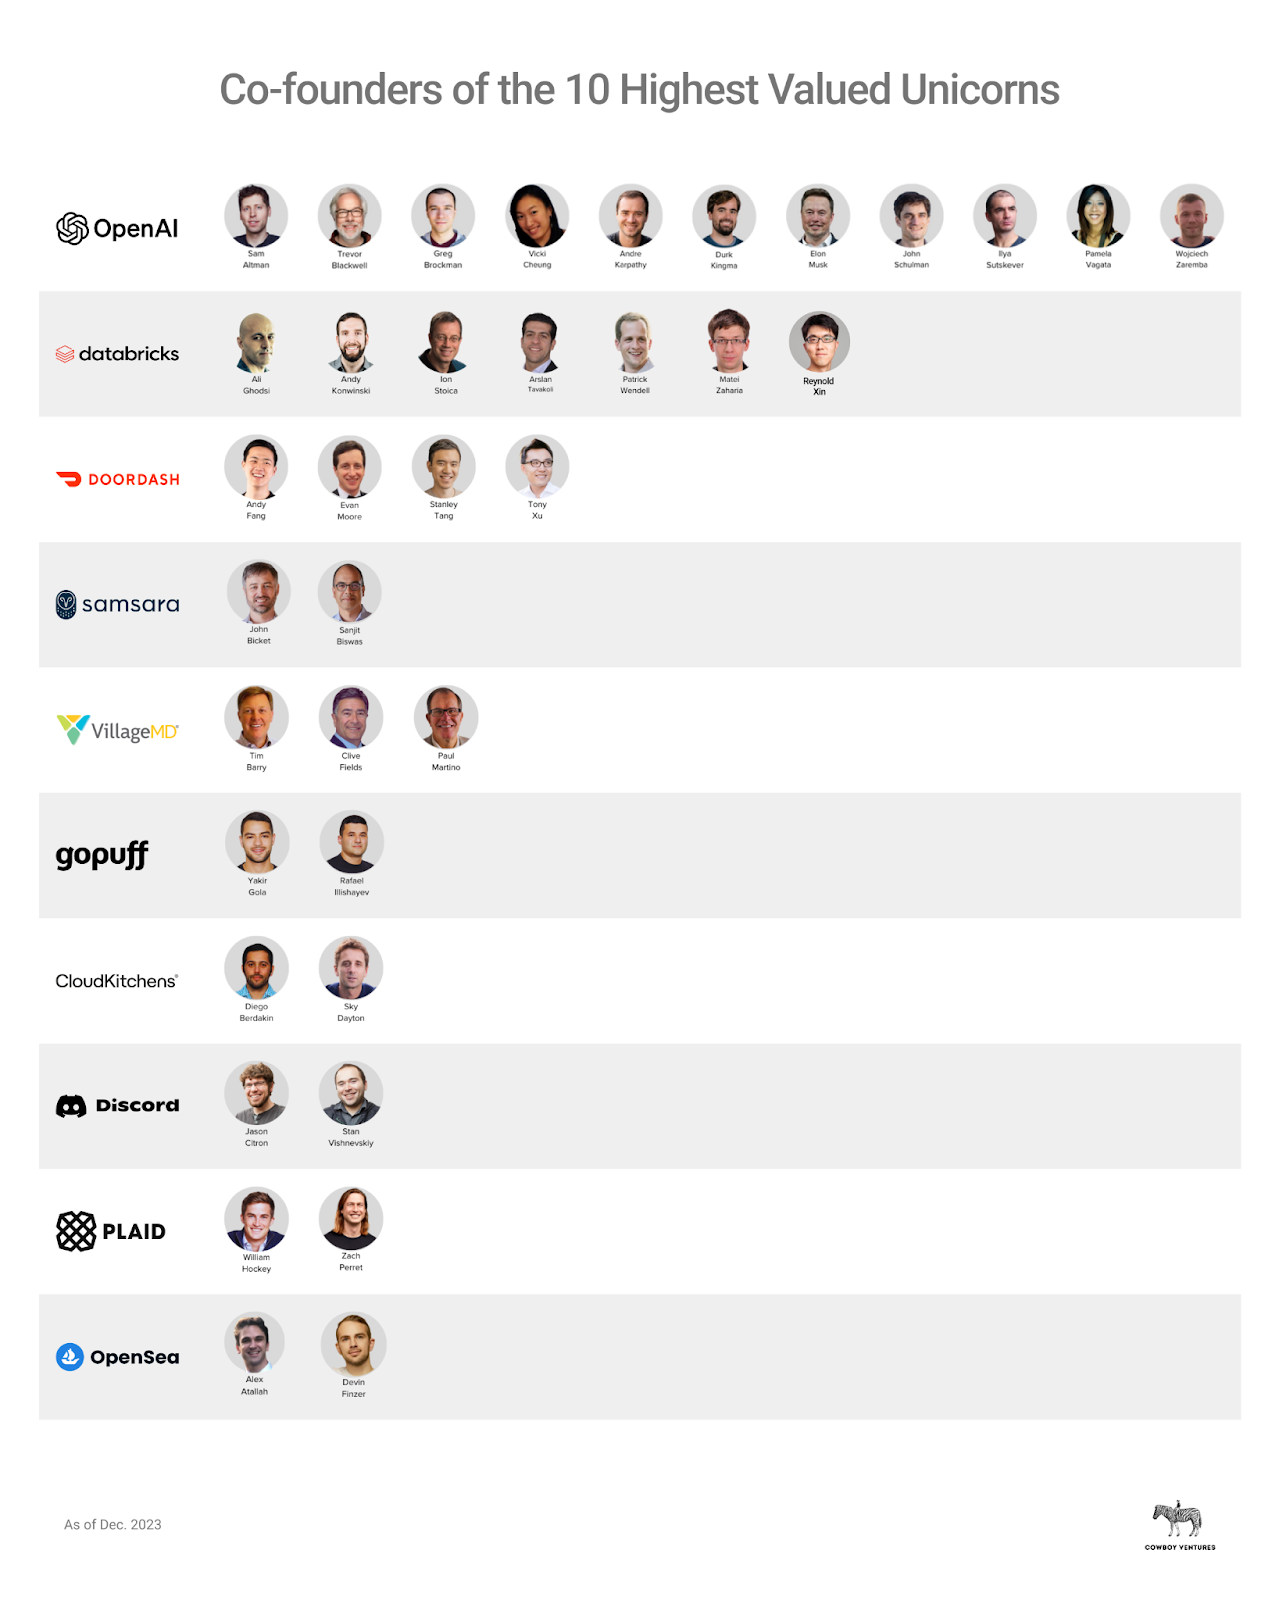
Notice what most of these founders have in common? Image Credits: Cowboy Ventures
Eighty-three percent of unicorns in the last decade had co-founders (versus 90% in 2013). On average, companies had three co-founders — same as 10 years ago. The average age at founding was 35, one year older than 2013. Twenty-somethings and college dropouts are still outliers.
About 70% of founders worked previously in tech, very similar to our 2013 data.
Around 65% of founders went to school or worked together (a decrease from 90% in 2013), and 67% of teams have a co-founder with founder experience of some kind (versus 80%). Prior pursuits ranged from founding a small tutoring biz, to Jet.com and Twitch, to a fallen unicorn like WeWork.

Image Credits: Cowboy Ventures
But founders’ educational and work backgrounds are much more diverse today. Only about 20% of founders went to a “top 10 school” (as defined by U.S. News & World Report) compared to two-thirds in 2013. No school has more than 5% “market share.” Stanford still leads as the alma mater of 5%, but accounts for much less than the 33% it did in 2013.
About 40% of co-founders are “non-technical” by education, bucking the “founders must be technical” stereotype. Twenty-five percent majored in business and 15% in the humanities, while 60% majored in a STEAM field. In 2013, 90% of CEOs had technical degrees, a big change. According to People Data Labs, just around a third of founders previously held software engineering roles.
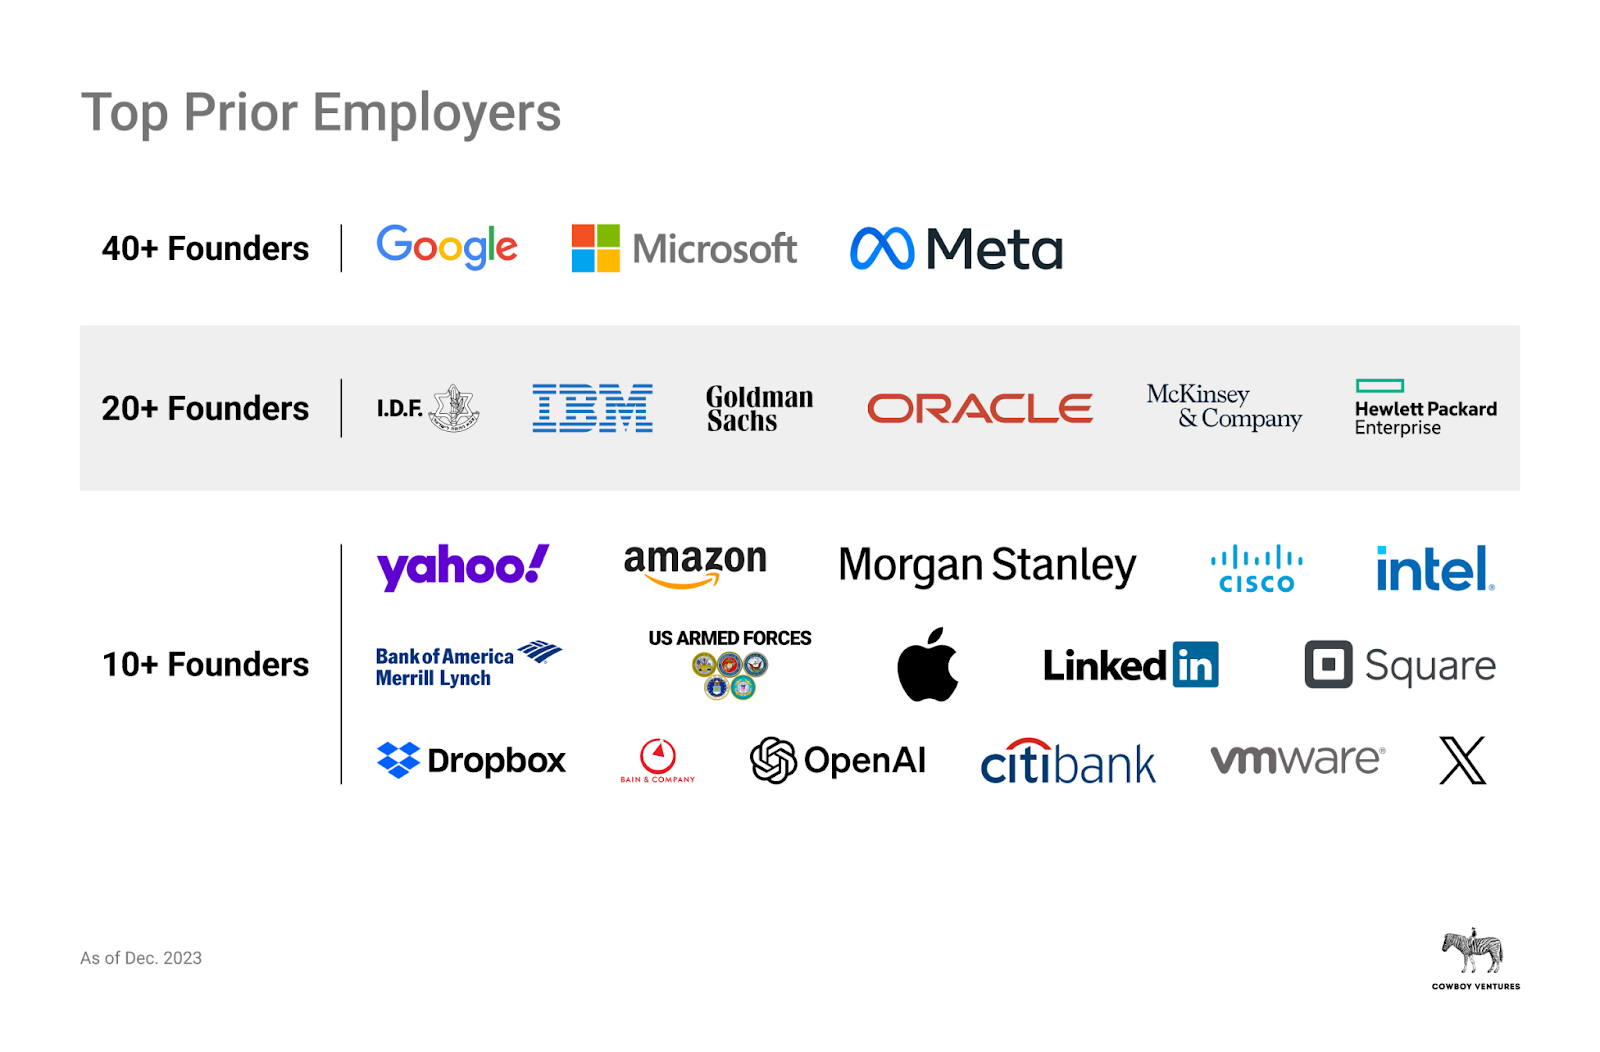
Prior employers include superunicorns, banking, consulting and military. Image Credits: Cowboy Ventures
A surprisingly high 20% of co-founders previously worked at a superunicorn, likely tied to the fact that 70% of co-founders today have worked previously in tech. Google leads as the top breeding ground for unicorn founders: We found 87 with work experience at Google, which is about 6% of co-founders.
Diversity has lots of room for improvement
As unicorns proliferated, co-founders’ geographies, education and work backgrounds did, too. This is exciting news for future founders.
Improvement has been slow when it comes to co-founder gender diversity: Just 14% of unicorns now have a female co-founder (versus 5% in 2013), and 5% have a female founding CEO (compared to none in 2013).
These numbers are still quite pathetic: There are more founders named Michael, David and Andrew than there are women CEOs of unicorns. At this rate, we won’t reach equal gender representation until 2063.
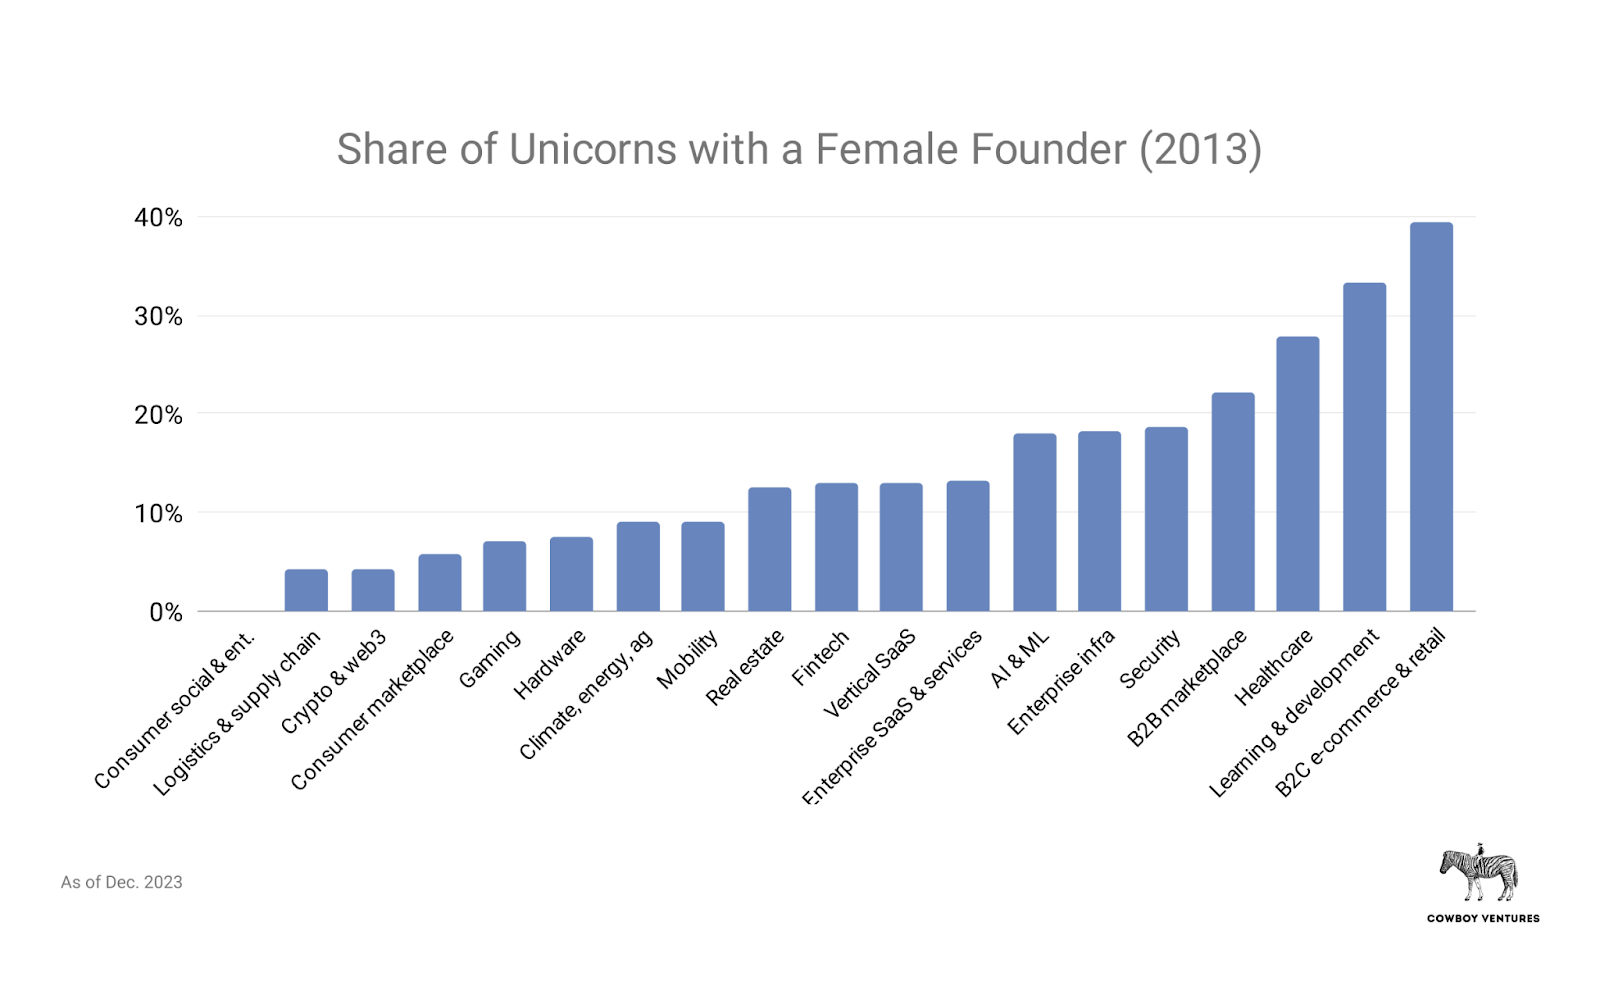
Some sectors have more gender diversity at the top vs. others. Image Credits: Cowboy Ventures
It’s challenging to track other aspects of identity like race or whether the person is a member of the LGBTQ+ community. Myriad studies show diverse teams deliver better results, including in downturns, so improving diversity given the tougher times seems like a no-brainer.
Case in point: The elite public unicorn club has higher gender diversity at the top: 14% have female CEOs (two) and 21% have female co-founders (three).
Looking ahead: The next 10 years
If the past is a prologue, expect change ahead for this herd of unicorns and a very different, much larger list in 2033. Numbers, sectors, and founder backgrounds changed so much this past decade.
Our original 39 had mixed fates. About half are currently public companies and around 80% are worth more today. Three more became superunicorns (ServiceNow, Palo Alto Networks and Uber), and network effect companies (we love network effects!) also grew stronger (Uber + Airbnb + LinkedIn = value of whole original list).
Enterprise companies fared more reliably, increasing 6x in value since 2013. All but one (Rocket Fuel) maintained unicorn status through the second decade. So consumer companies had bumpier journeys. Thirty-three percent are smaller today (Lending Club, Yelp), and some have had fire sales or shut down (Tumblr, Zulily).
The size, scale and number of VC firms will also change in the coming years. In 2013, there were about 850 active venture funds. Today there are about 2,500. As unicorns fall out of the dataset, we expect more change in VC firms. Some VCs will retire, some will raise smaller funds (right-sized for better returns), downsize teams, or fold. Given the likelihood of lower returns from many papercorns in this herd, change seems inevitable. We’ve seen “VC musical chairs” in previous cycles, and it’s happening again.
As noted in our original post, multi-billion-dollar VC funds need multi-billion-dollar outcomes to deliver acceptable returns. As funds got bigger, their incentives changed and drove round sizes and valuations higher, with some negative consequences. We don’t expect VC firms to go back to 2013 in staff or AUM. But the lessons here should give founders, VCs and LPs lots of caution about too much money, too early and too fast — and from whom.
That said, despite the sins of the past decade, technology continues to change our world. Founders have access to more inspiration, role models, capital and talent than ever. Unicorns are still relatively few and small versus the number of much larger, slower-moving companies with outdated technology. We see miles of green fields for more unicorns in years to come.
What does this all mean?
The march of technology has created so many more unicorns, serving a much wider array of sectors. Crunching the numbers, you can’t help but reflect on the enormous societal and financial impact VC-backed tech has had and get excited for more history to unfold.
It feels like we’re living during a new Industrial Revolution, powered by software, that is starting to spread to more and more sectors of society. Less than 10% of today’s Fortune 500 companies are tech companies. In the next 10 years, we expect the share to rise — and many to be from the 2023 herd.
We’ve also learned indelible lessons. That macroeconomic factors and cycles matter. The massive influx of private capital caused a proliferation of companies but a decline in capital efficiency discipline, which will degrade financial outcomes for years, given how many are still papercorns.
The cycle is far from over. The venture ecosystem will feel the impact of the past decade in years to come via more shutdowns, down rounds and scarred founders, employees and investors.
Valuation is also clearly a convenient but imperfect, impermanent measure of success. Becoming a unicorn at a young age might even be a curse! Founders today can see how chasing vanity valuations with weak underlying fundamentals can lead to unintended poor outcomes.
There were times in the decade when many believed building a unicorn was easy and common. Elder unicorns know that it’s not. It requires the sustained magic of product and velocity, customer love, business model economics, capital efficiency, relentless execution and more, over many years.
We tip our hats once again to the hundreds of companies (no longer tens!) that achieved and maintained unicorn milestones. Building and sustaining more than $1 billion in value in the past 10 years was statistically improbable and a major, special team effort.
Finally, if you made it this far, thank you for taking the time to dive into our labor of love. We hope you enjoyed it. We’d love comments on what you appreciated most, disagree with, what we missed, or what you’d like more of.
For more like this (although we promise other posts are shorter), give us a follow on LinkedIn, Medium, and X (@CowboyVC, @aileenlee, @allegra_v2).

